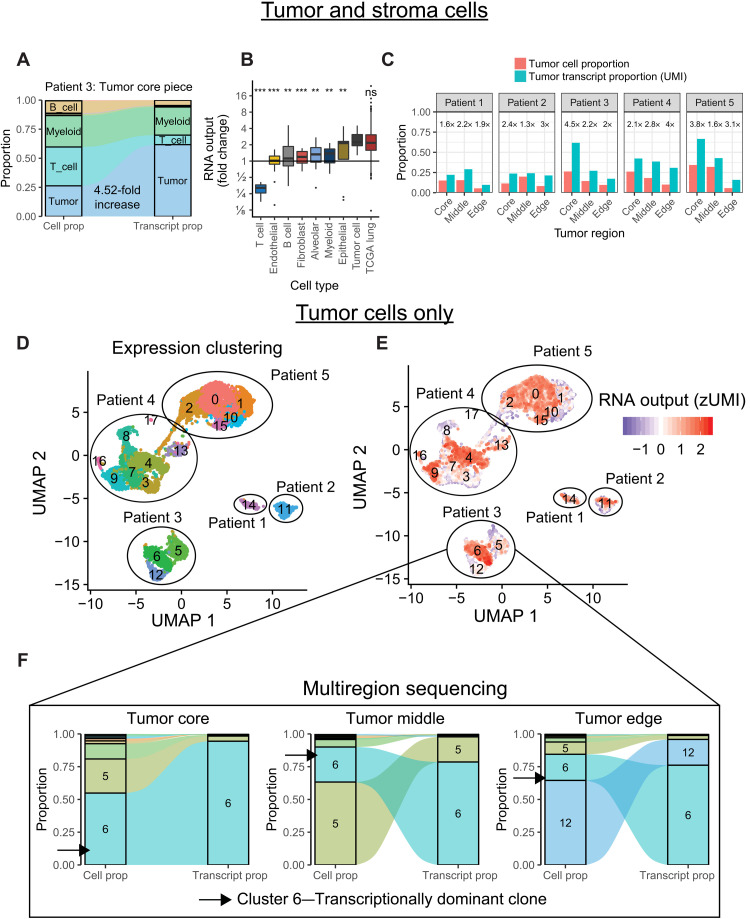
Fig. 3. Hypertranscription in single cells.
(A) Flow diagram depicting the proportional cell counts and transcript counts for different cell types from a primary lung cancer sample. Fold changes in RNA output between tumor and normal cell populations can be estimated from these data, similar to RNAmp. (B) Boxplot summarizing the relative fold change values in RNA output for various cell populations identified from scRNA-seq. Tumor cells have consistently elevated RNA output levels, equivalent to values derived from the bulk TCGA lung dataset (***P < 0.001 and **P < 0.01, Student’s two-sided t test). ns, not significant. (C) Bar charts of tumor cell proportion and tumor transcript proportion from five patients with multiregion scRNA-sequenced lung cancer. Cancer cells consistently increase their relative transcript proportion regardless of tumor region or tumor cellularity. Numbers above each set of bar plots indicate relative fold change in RNA output of tumor cells. (D) Uniform Manifold Approximation and Projection (UMAP) distance plot showing scRNA-seq expression clustering results for tumor cell populations. Subclusters were identified in patients 3 to 5. (E) RNA output of single cells overlaid onto the UMAP expression clusters reveals distinct subclusters of tumor cells within each sample undergoing hypertranscription. (F) Flow diagram depicting the proportional cell counts and transcript counts for different tumor subclusters across spatially distinct tumor regions from patient 3. Subcluster 6 maintains transcriptional dominance across tumor regions, even when it becomes a minority population by cell proportion. Boxplots are defined in Fig. 1E.

