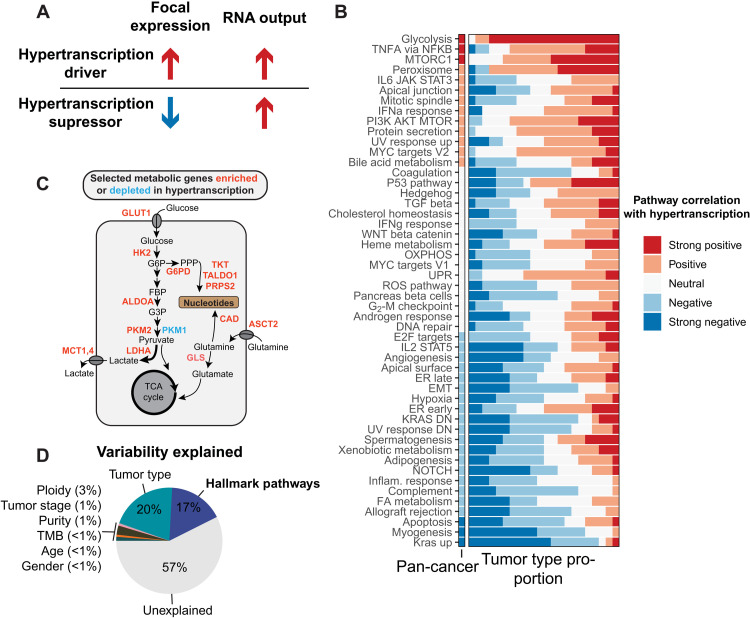
Fig. 4. Integrating focal and global gene expression data reveals pathways of oncogenic hypertranscription.
(A) Hypertranscription can be driven by specific genes and expression pathways either through their focal expression gain (drivers) or through their focal expression loss (suppressors). (B) Correlations between 50 hallmark signaling pathways and RNA output across the pan-cancer cohort and across individual tumor types (displayed as the proportion of tumor types with a given correlation) KRAS DN, KRAS down; DN, down. (C) Diagram depicting selected metabolic genes either enriched (red) or depleted (blue) in hypertranscribing samples. Genes involved in shunting glucose and glutamine toward nucleosynthetic pathways are all elevated in the hypertranscriptional state. TCA, tricarboxylic acid. (D) The proportion of variability explained in the pan-cancer cohort when including hallmark pathway expression. IL6, interleukin-6; JAK, Janus kinase; STAT3, signal transducer and activator of transcription 3; IFNa, interferon-a; PI3K, phosphatidylinositol 3-kinase; UV, ultraviolet; TGF, transforming growth factor; OXPHOS, oxidative phosphorylation; UPR, unfolded protein response; ROS, reactive oxygen species; ER, endoplasmic reticulum; EMT, epithelial-mesenchymal transition; FA, fatty acid.

