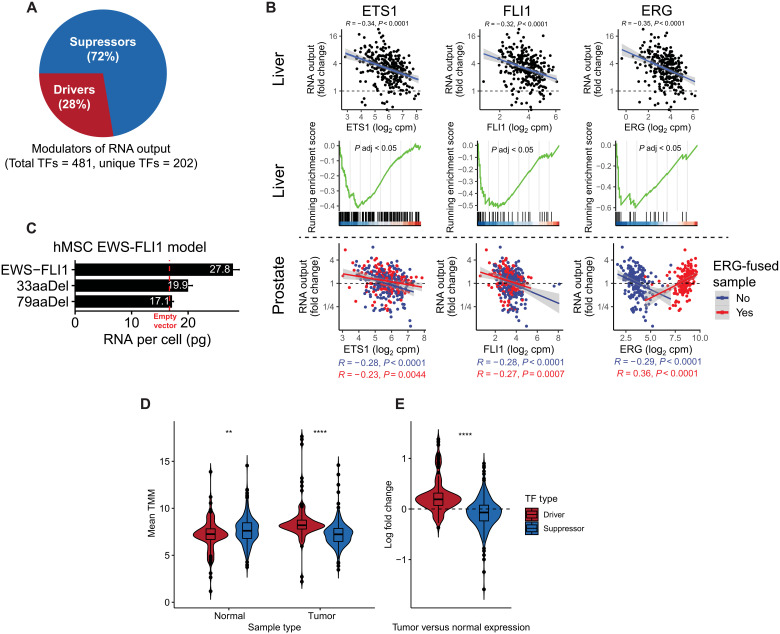
Fig. 5. Evidence of transcriptional derepression as a mechanism driving oncogenic hypertranscription.
(A) Pie chart depicting the proportion of TF drivers and suppressors of hypertranscription. (B) Top: Pearson correlation between ETS1, FLI1, and ERG and RNA output in liver cancer. Middle: ETS1, FLI1, and ERG target genes are enriched in hypotranscribing liver cancers and depleted in hypertranscriptional samples. Bottom: Pearson correlation between ETS1, FLI1, and ERG and RNA output in prostate cancers with or without ERG fusions. (C) RNA per cell measurements from a human mesenchymal cell model expression either full-length EWS-FLI1, empty vector, or C-terminal truncating mutations in FLI1 of either 33 or 79 amino acids in length. Error bars correspond to SD. hMSC, human mesenchymal stem cell. (D) Mean expression values of TF drivers and suppressors of transcriptional output in GTEx normal and TCGA tumor samples. TMM, trimmed mean of M values (E) Summarized log fold change in expression of TF driver and suppressor expression between tissue-matched tumor and normal samples. **P < 0.01; ****P < 0.0001.

