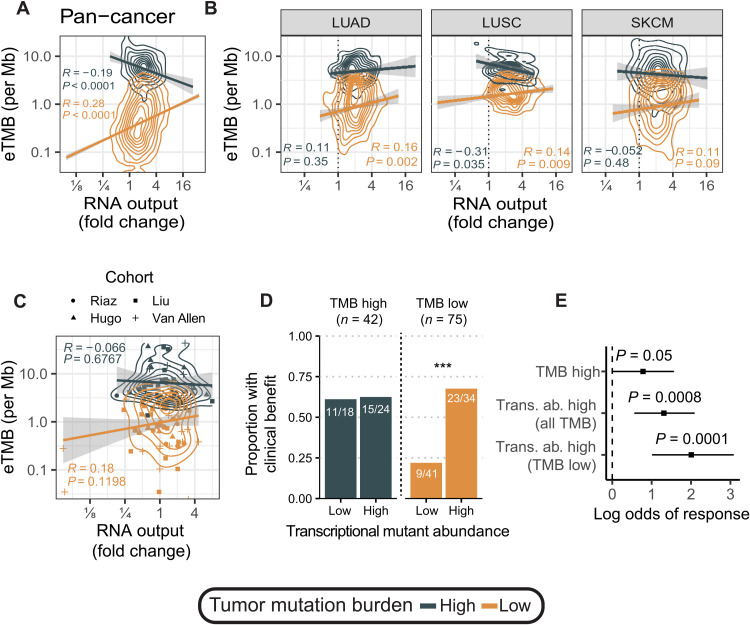
Fig. 7. Transcriptional mutant abundance as a biomarker for ICI response.
(A) Pan-cancer correlation between eTMB and hypertranscription for hypermutant (>10 mut/Mb) and nonhypermutant tumors (<10 mut/Mb). (B) Correlation between eTMB and hypertranscription for hypermutant (>10 mut/Mb) and nonhypermutant tumors (<10 mut/Mb) in lung cancers (LUAD and LUSC), and SKCM. (C) Correlation between eTMB and hypertranscription for hypermutant (>10 mut/Mb) and nonhypermutant tumors (<10 mut/Mb) in four melanoma ICI cohorts. (D) Proportion of patients with clinical benefit from ICI therapy in high- and low-TMB groups split by transcriptional mutant abundance levels. ***P < 0.001. (E) Log odds of response to ICI therapy for different TMB markers. Transcriptional mutant abundance is an overall better predictor of ICI response compared to genomic TMB. Error bars on log odds coefficients represent the 95% CI.

