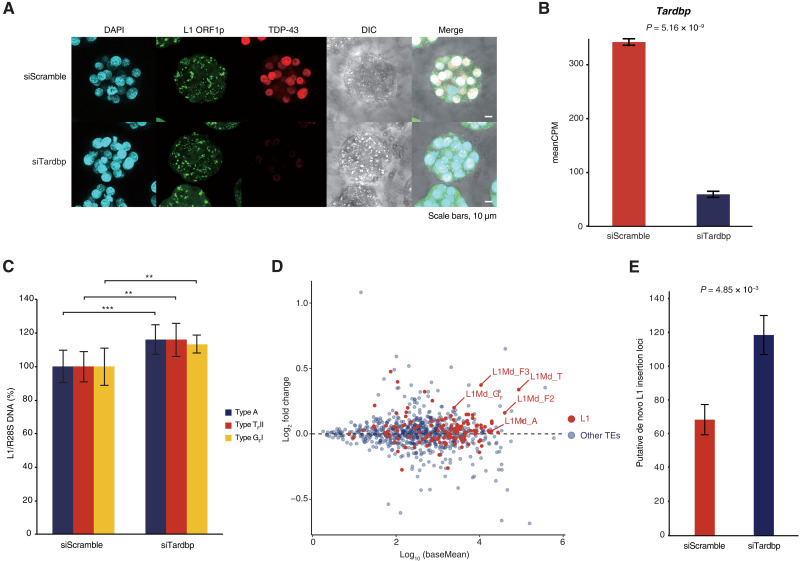
Fig. 3. Zygotic TDP-43 KD leads to increased L1 retrotransposition.
(A) Immunofluorescence of zygotes injected with control (siScramble) or TDP-43 (siTardbp) targeting siRNA. TDP-43 KD morulae show strongly decreased TDP-43 signal. Images are maximal Z projections of confocal sections. (B) Expression level of Tardbp as assessed by RNA-seq with and without KD. (C) qPCR using primer sets targeting active L1 subfamilies (29) with WGA DNA from five blastocysts (4.5 dpc) ± TDP-43 KD as template. Expression of active L1 subfamilies was increased in TDP-43 KD embryos. **P ≤ 0.01 and ***P ≤ 0.001. (D) MA, mean average plot showing expression change of TEs in TDP-43 KD embryos. Horizontal axis: log10 normalized read count (baseMean); vertical axis: log2 fold change of expression level in KD embryos versus control embryos. L1 elements are highlighted in red. Here, we adopted the L1 classification of repeat masker in RNA-seq analysis, so L1Md_A corresponds to subfamilies L1MdA_I, L1Md_AII, and L1Md_AIII; L1Md_T corresponds to subfamilies TF and GF; L1Md_F2 corresponds to L1Md_AIV, L1Md_AVII, and L1Md_F; L1Md_F3 corresponds to the remaining A subfamily and partial of subfamily L1Md_N_I (30). (E) Targeted enrichment sequencing was used to detect previously unannotated putative L1 insertion sites in TDP-43 KD embryos (4.5 dpc) and in control embryos (4.5 dpc).

