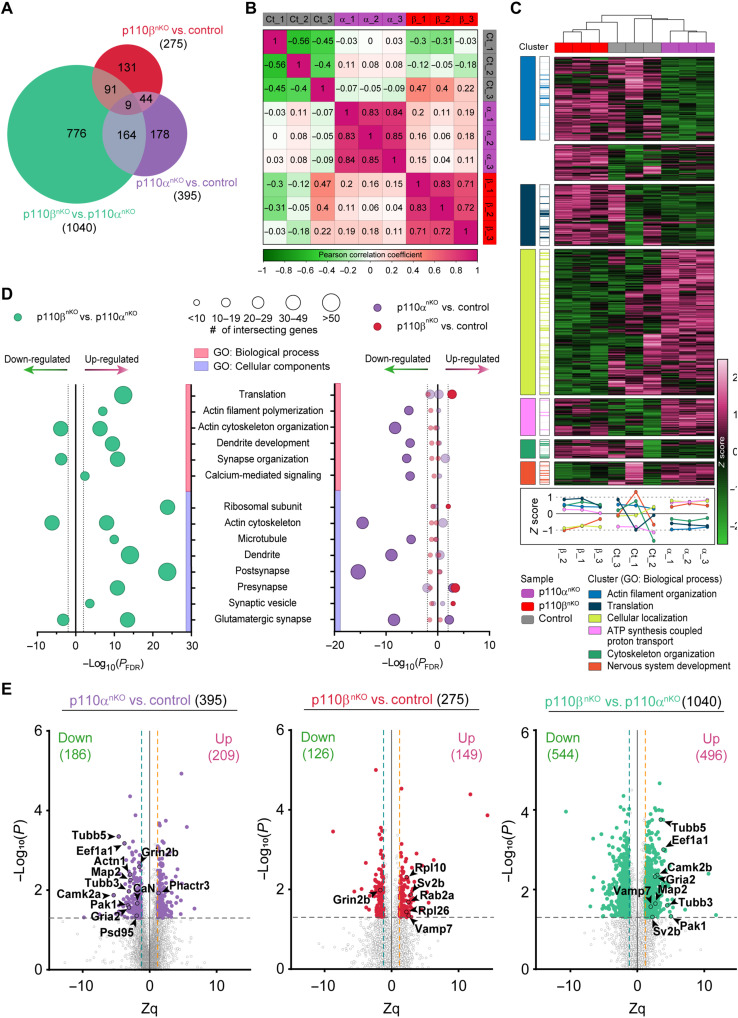
Fig. 1. Proteomic analysis of mice lacking neuronal p110α or p110β.
(A) Venn diagram of DEPs for all possible comparisons. (B) Similarity matrix showing pairwise distances between samples, measured by Pearson correlation. (C) Unsupervised hierarchical clustering based on Euclidean distances for the 1710 DEPs. Colors represent row-scaled expression values (green, low expression; magenta, high expression). Seven protein clusters were identified on the basis of their expression pattern, and GO biological process enrichment analysis was performed on each cluster. GO biological process terms are annotated for each cluster (left cluster panel), and the intersecting proteins from the dataset are highlighted with the same color code (right cluster panel). Clusters are also represented by sample expression levels in the panel below the heatmap. (D) GO enrichment analysis of the DEPs (|Zq| > 1.2 and P < 0.05) for p110β versus p110α (left plot) and for p110α and p110β versus control (right plot). For both plots, GO biological process and cell components are plotted against the adjusted P value by Benjamini-Hochberg false discovery rate (FDR) correction (PFDR). Dotted lines represent significance threshold (PFDR < 0.01, |log10(PFDR)| > 2) for all GO terms, and the size of the points represents the number of intersecting genes between the dataset and the GO biological process or the GO cell component. Sign on the x axis represents up- or down-regulation. n = 3 mice per group. (E) Volcano plots of DEPs (|Zq| > 1.2 and P < 0.05) comparing p110αnKO versus control (left), p110βnKO versus control (center), and p110βnKO versus p110αnKO (right). Each point represents the average fold change of one protein and the P value for that comparison. Dashed lines represent significance thresholds [|Zq| > 1.2 and –log10(P) > 1.3]. Sign on the x axis represents up- or down-regulation. Names and outlined points represent top differentially up- or down-regulated proteins.

