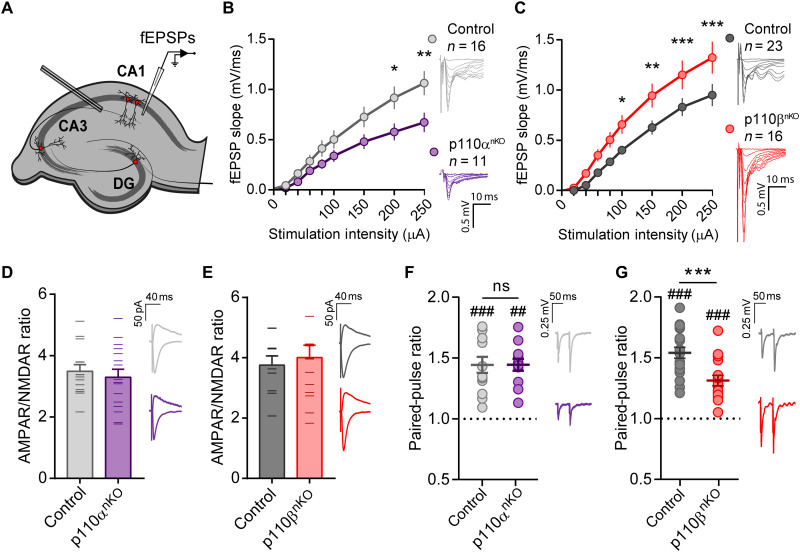
Fig. 5. Neuronal p110α and p110β isoforms have different effects on basal transmission.
(A) Experimental configuration for extracellular field recordings in acute slices. DG, dentate gyrus. (B and C) Input-output curves of the extracellular fEPSPs from p110αnKO (B) and p110βnKO (C) slices evoked at different stimulation intensities. p110αnKO: n = 16 slices from five mice; two-way repeated-measures ANOVA, F(8,200) = 4.177, P = 0.0001. p110βnKO: n = 18 to 16 slices from five mice; two-way repeated-measures ANOVA, F(8,256) = 5.97, P < 0.0001. Bonferroni’s posttest (*P < 0.05; **P < 0.01; ***P < 0.005). Representative traces from one experiment for each condition are depicted on the right. Scale bar, 0.5 mV, 10 ms. (D and E) Bar graph of the ratio of AMPAR- to NMDAR-mediated excitatory postsynaptic currents (EPSCs) in CA1 pyramidal neurons from p110αnKO and p110βnKO mice recorded on whole-cell voltage clamp configuration. AMPAR responses were measured at −60 mV and NMDAR responses at +40 mV, 60 ms after stimulation of the Schaffer collaterals. p110αflox/flox: control, n = 14; p110αnKO, n = 16 cells. p110βflox/flox: control, n = 10; p110βnKO, n = 14 cells from three mice per condition. Representative traces are shown on the right of each graph. Scale bars, 50 pA, 40 ms. No statistically significant differences were observed by two-tailed nonparametric Mann-Whitney test. (F and G) Average values of PPRs from fEPSP recordings from p110αnKO (F) and p110βnKO (G) slices with 50-ms interstimulus interval. Individual values for each condition are displayed as a dot plot. p110αflox/flox: vehicle, n = 13; p110αnKO, n = 12 slices. p110βflox/flox: vehicle, n = 19; p110βnKO, n = 16 slices from more than four mice per condition. Representative traces for each condition are shown on the right of each panel. Statistical differences between conditions were assessed with Mann-Whitney test (***P < 0.001). Wilcoxon matched-pairs signed-rank test was used to assess significant paired-pulse facilitation (##P < 0.01 and ###P < 0.005).

