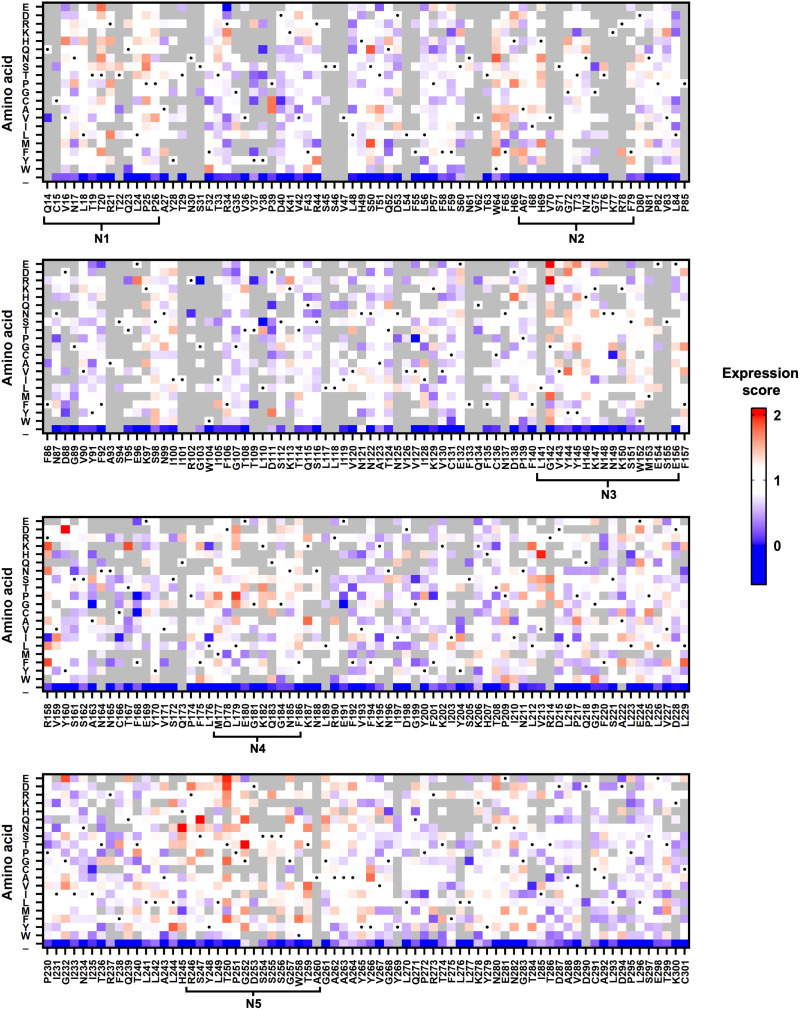
Fig. 1. Effects of NTD single mutations on S protein expression.
The expression scores of individual NTD mutations are shown as a heatmap. X axis represents the residue position. Y axis represents different amino acids and the stop codon (_). Amino acids corresponding to the wild-type (WT) sequence are indicated by the black dots. Mutations with a total frequency of <0.0075% were excluded from the analysis and shown in gray. Regions corresponding to the N1-N5 loops were defined as previously described (12).

