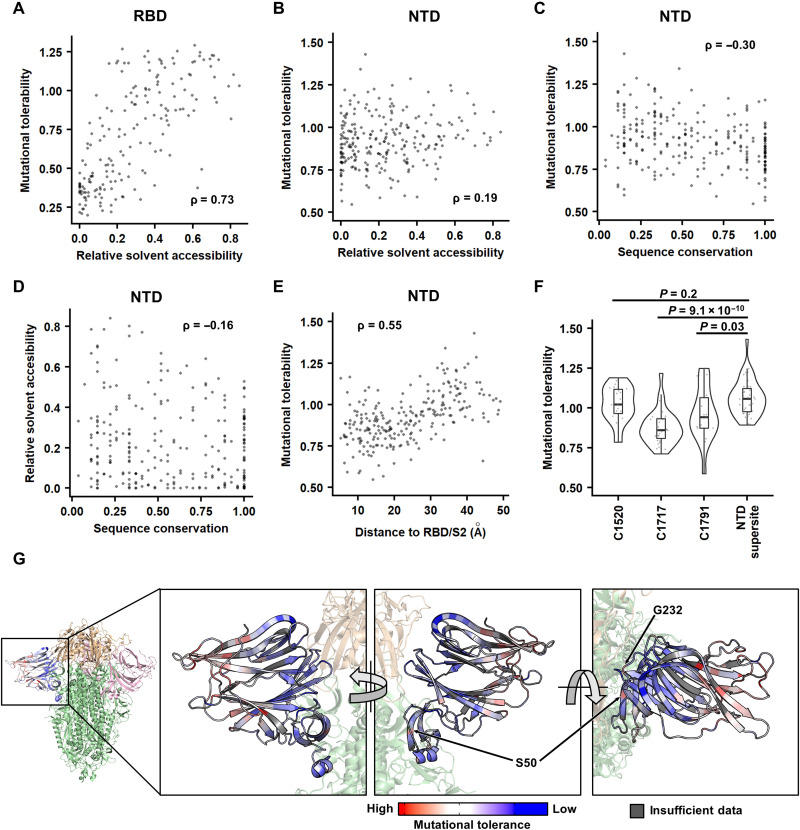
Fig. 2. Identifying the biophysical determinants of mutational tolerability.
(A and B) The relationship between RSA and the mutational tolerability is shown for (A) RBD and (B) NTD. The deep mutational scanning data on RBD expression were from a previous study (42). (C and D) Relationship between sequence conservation among 27 sarbecovirus strains (table S6) and (C) the mutational tolerability or (D) RSA of each NTD residue. (E) Relationship between the distance to RBD/S2 and the mutational tolerability of each NTD residue. (A to E) Each data point represents one residue. The Spearman’s rank correlation coefficient (ρ) is indicated. (F) The mutational tolerability of residues within the cross-neutralizing NTD antibody epitopes (C1520, C1717, and C1791) (16) is compared to that within the antigenic supersite (14) using a violin plot. Each data point represents one residue. P values were computed by two-tailed t test. (G) The mutational tolerability of each NTD residue is projected on one NTD of the S trimer structure [Protein Data Bank (PDB) 6ZGE (45) and PDB 7B62 (46)]. Red indicates residues with higher mutational tolerability, while blue indicates residues with lower mutational tolerability. Residues with insufficient data to calculate mutational tolerability are colored in gray. Two residues of interests, namely, S50 and G232, are indicated. RBDs are colored in wheat, the two other NTDs are in pink, and the rest of the S1 and S2 subunits are in green.

