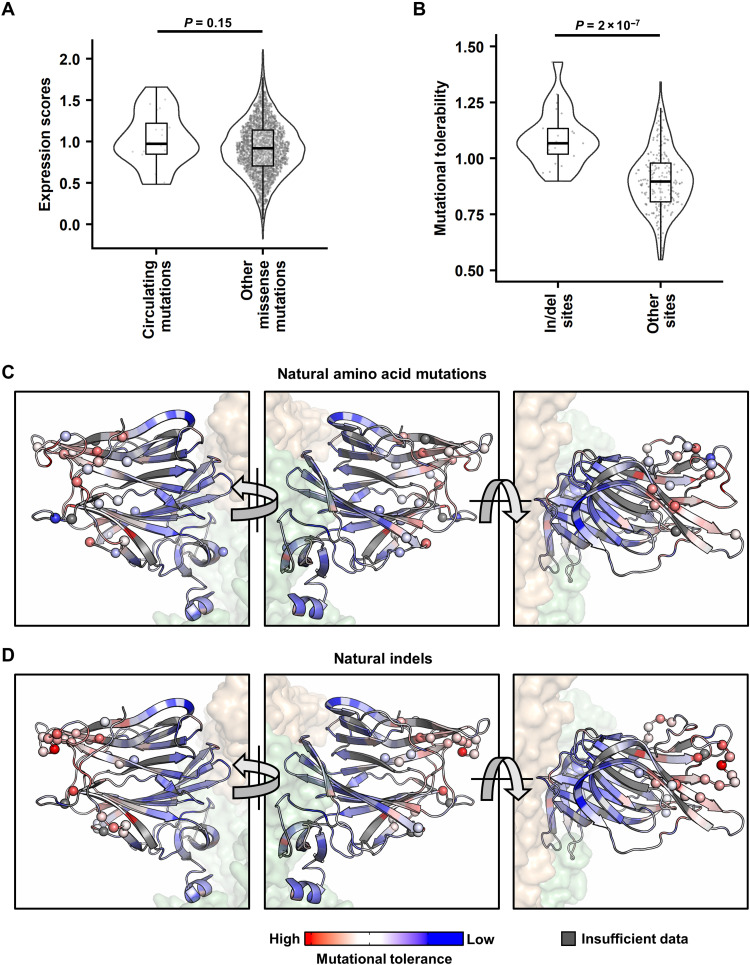
Fig. 3. Analysis of naturally circulating NTD mutations.
(A) Expression scores of naturally occurring NTD mutations and all other missense mutations. (B) Mutational tolerability of naturally occurring indel sites and all other sites. P values were computed by two-tailed t test. (C and D) Missense mutations (C) and indel sites (D) observed in 17 SARS-CoV-2 major variants are labeled as spheres on one NTD of the S trimer structure [PDB 6ZGE (45) and PDB 7B62 (46)]. Red indicates residues with higher mutational tolerability, while blue indicates residues with lower mutational tolerability. Residues with insufficient data to calculate mutational tolerability are colored in gray. The neighboring RBDs are colored in wheat, and the rest of the S1 and S2 subunits shown are colored in green.

