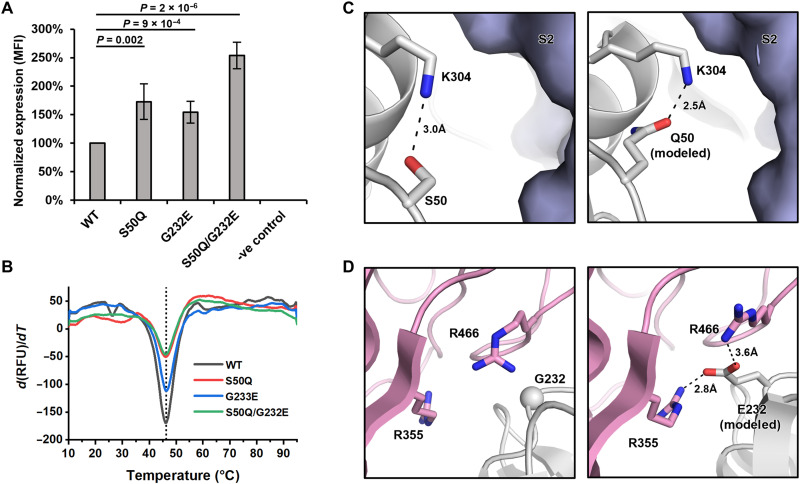
Fig. 4. S50Q and G232E at the interdomain interface increase S protein expression.
(A) Cell surface S protein expression of WT and NTD mutants was quantified using flow cytometry analysis with CC40.8 as the primary antibody. Untransfected HEK293T landing pad cells were used as a negative control (-ve control). S protein expression level was defined as the MFI of the positive gated population. S protein expression level was normalized to WT. The error bar indicates the SD of six independent biological replicates. P values were computed by two-tailed t test. (B) Thermostability of WT S protein and selected NTD mutants was measured using differential scanning fluorimetry. The black vertical dotted line indicates the melting temperature of WT (Tm = 46.2°C). (C and D) Rosetta-based structural modeling of (C) S50Q and (D) G232E was performed using the structure of S protein (PDB 6ZGE) (46). The three protomers of the S protein are colored in white, light blue, and pink. Potential interactions are represented by black dashed lines with distance labeled.

