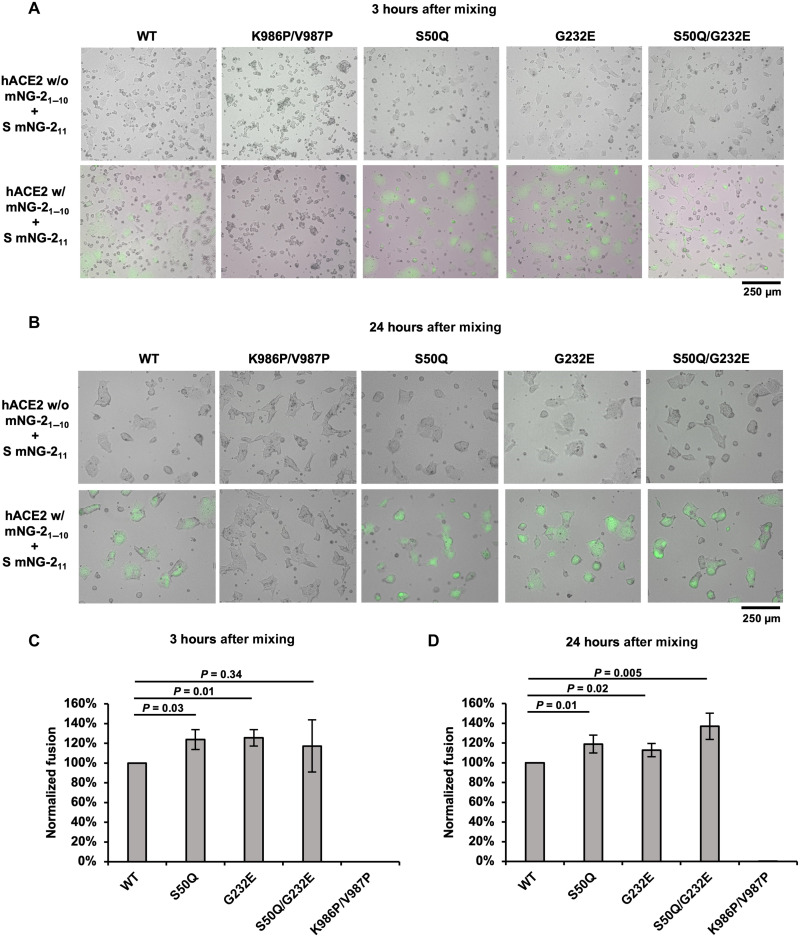
Fig. 5. S50Q, G232E, and S50Q/G232E do not diminish fusion activity.
(A and B) Fluorescence microscopy analysis of the fusion events at (A) 3-hour and (B) 24-hour postmixing of cells expressing S and mNG211 (S cells) and cells expressing hACE2 and mNG21–10 (hACE2 cells). Cells with green fluorescence signals are the fused cells. Scale bars are shown at the bottom right corner. (C and D) Fusion activity of WT and selected NTD mutants at (C) 3-hour and (D) 24-hour postmixing was quantified using flow cytometry analysis. Fusion activity was normalized to WT. The error bar indicates the SD of at least four biological replicates. P values were computed by two-tailed t test.

