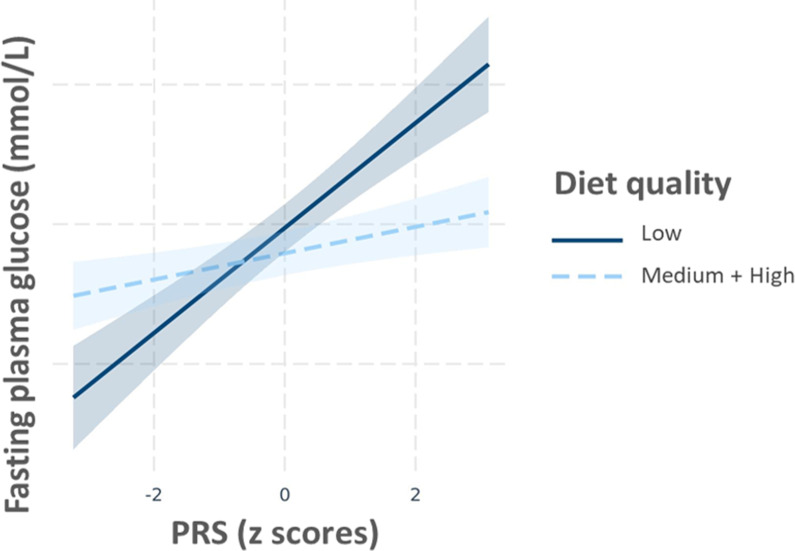
Figure 2. Multivariable regression of PRS (continuous) fasting plasma glucose (FPG) stratified by diet quality score in START.
Regression lines (with 95% confidence limits) represent predictions of FPG. Models are adjusted for maternal age, and BMI. BMI, body mass index; PRS, polygenic risk score; START, SouTh Asian BiRth CohorT.

