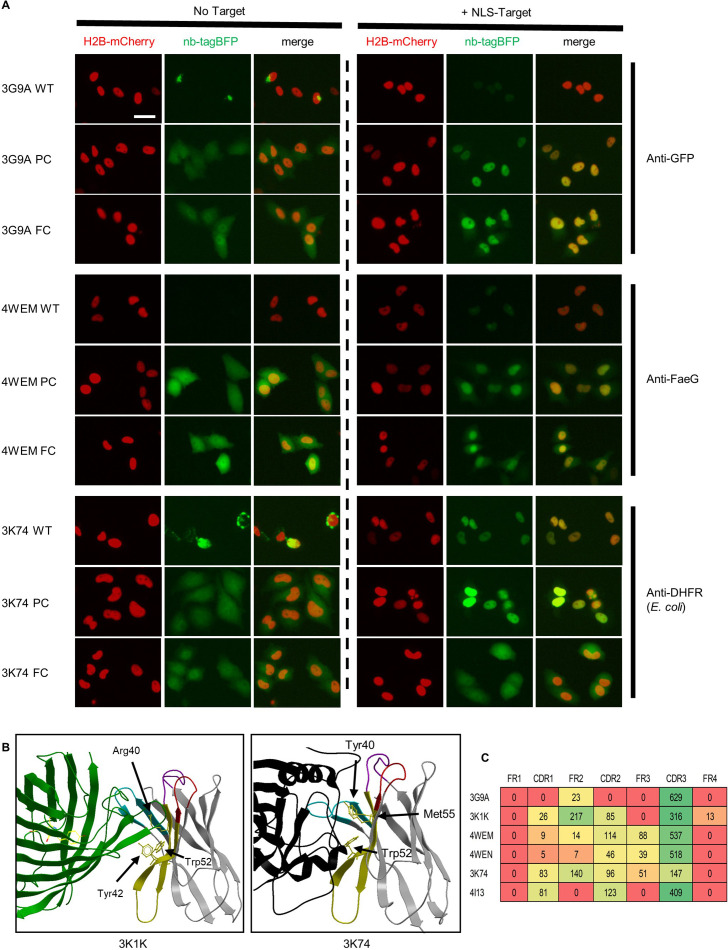
Figure 8. Target binding of parent and mutationally stabilized nanobodies.
(A) Representative images of nanobody-TagBFP expression in HeLa cells in the presence and absence of nuclearly localized target. Wild-type (WT) nanobodies, partial consensus (PC) mutants, and full-consensus (FC) mutants are depicted. Red nuclear signal is from co-transfected CAG-H2B-mCherry plasmid. Transfected DNA and nuclear protein amounts were standardized by addition of off-target nuclear localization sequence (NLS) plasmid to transfection mix for the ‘no target’ condition. Scale bar is 25 µm. (B) Crystal structures of two nanobodies that lose target binding when mutated to adhere to a full-consensus framework are shown. Non-consensus framework residues directly contributing to target interface are depicted. (C) Target-interfacing surface area values in square angstroms (rounded to whole numbers) across distinct regions for nanobodies tested for target binding are shown. Values are taken from buried surface area interface values made available through PDBE-PISA.


