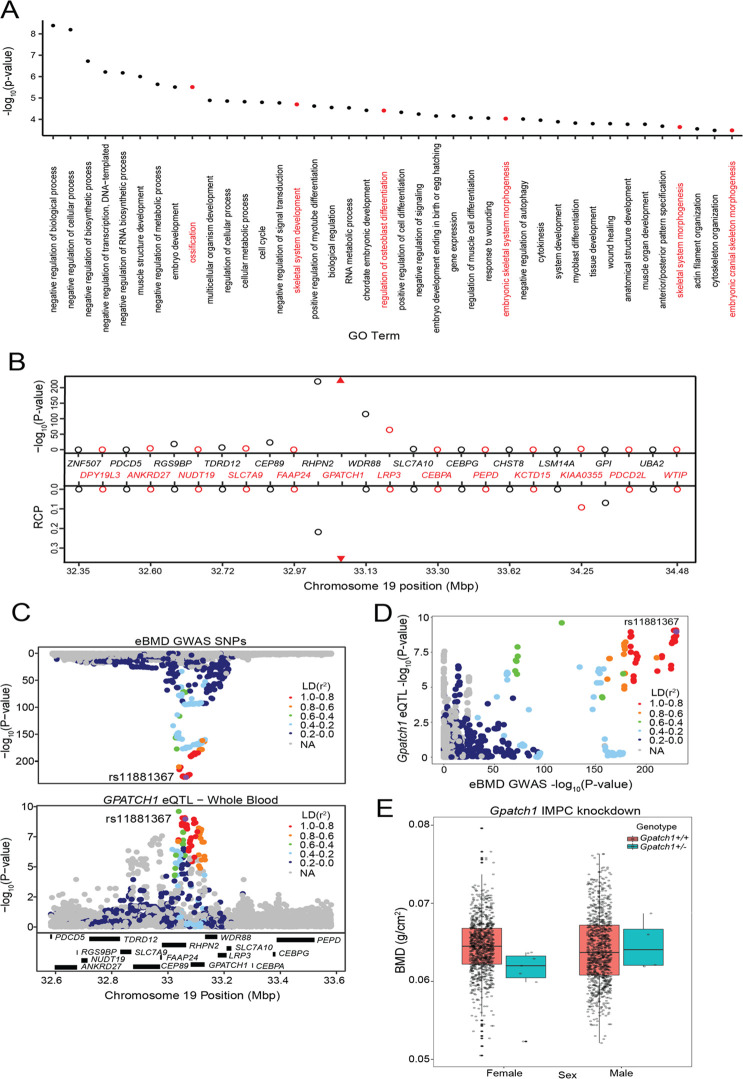
Figure 2. Transcriptome-wide association study (TWAS) and expression quantitative trait loci (eQTL) colocalization identify Gpatch1 a potentially causal bone mineral density (BMD) genome-wide association study (GWAS) gene.
(A) The top 40 terms from a Gene Ontology analysis of the 512 potentially causal BMD genes identified by our analysis. Terms with clear relevance to bone are highlighted in red. Only terms from the ‘Biological Process’ (BP) subontology are listed, and similar terms were removed for clarity. (B) TWAS/colocalization plot for genes in the locus around GPATCH1 (±1.5 Mbp). The −log10 Bonferroni-adjusted p values from the TWAS analysis (top panel) and the maximum regional colocalization probabilities (RCPs) from the colocalization analyses (bottom panel). Genes alternate in color for visual clarity. Triangles represent GPATCH1. (C) Mirrorplot showing estimated BMD (eBMD) GWAS locus (top panel) and colocalizing GPATCH1 eQTL in whole blood (bottom panel). SNPs are colored by their linkage disequilibrium (LD) with rs11881367 (purple), the most significant GWAS SNP in the locus. (D) Scatterplot of −log10 p values for GPATCH1 eQTL versus eBMD GWAS SNPs. SNPs are colored by their LD with rs11881367 (purple). (E) BMD in Gpatch1 knockdown mice. N = 7 females and N = 4 males for Gpatch1+/− mice, N = 880 females and N = 906 males for Gpatch1+/+ mice. Boxplots indicate the median (middle line), the 25th and 75th percentiles (box) and the whiskers extend to 1.5 * IQR.


