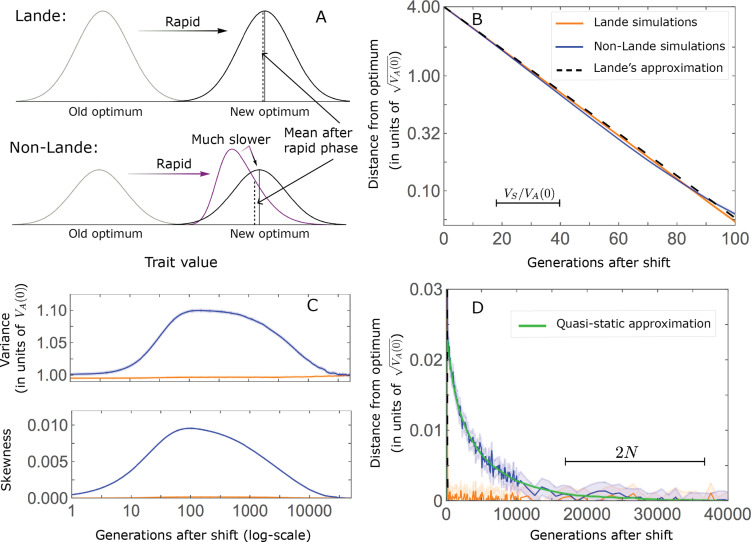
Figure 2. The phenotypic response to a shift in optimal phenotype.
(A) Cartoon of the two kinds of phenotypic response: (i) the Lande approximation, in which the mean approaches the new optimum exponentially with time and the phenotypic distribution maintains its shape; (ii) substantial deviations from Lande’s approximation, in which the mean approaches the new optimum rapidly at first, but during this time the phenotypic distribution becomes skewed, causing the mean’s approach to slow down dramatically, to a rate that is dictated by the decay of the 3rd central moment. (B) In both the Lande and non-Lande cases, the mean phenotype initially approaches the new optimum rapidly. This approach is described by Lande’s approximation, and is thus almost identical in the two cases (which is why only the Lande curve is visible). The simulation results were generated using the all alleles simulation with a shift of , as detailed in Simulations and resources. For each quantity described in B-D, we show the simulations’ mean ±1.96 SE (solid lines and shaded regions, respectively). (C) In the non-Lande case, the phenotypic variance and skewness increase during the rapid phase and then take a very long time to decay to their values at equilibrium. (D) Over the longer-term, the approach to the optimum in the non-Lande case almost grinds to a halt, where its rate can be described by the quasi-static approximation (Equation 6). While the non-Lande response differs from Lande’s approximation, the difference is small: the maximal deviation in mean phenotype is , the variance increases by ∼ 10% and the maximal skewness is tiny (less than 0.01).

