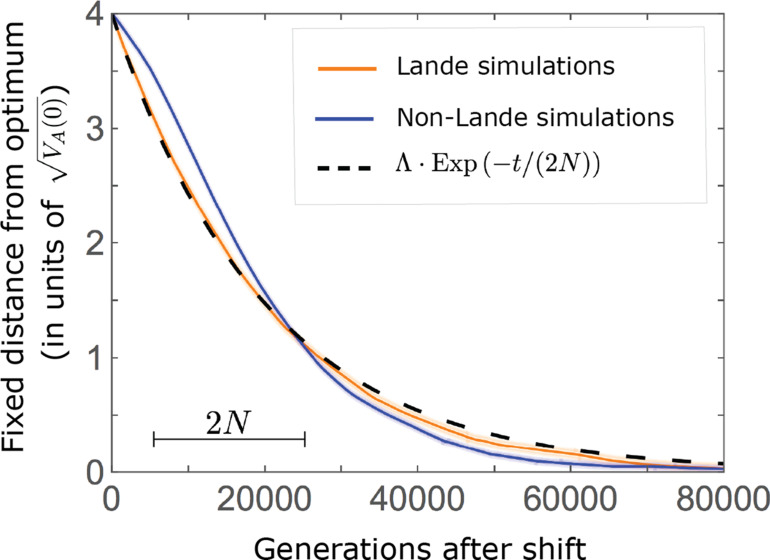
Figure 8. Equilibrium around the new optimum is restored on a time scale of generations after the shift.
The change in fixed distance after the shift estimated using all alleles simulations for the Lande and non-Lande cases (see section on Simulations and resources) is compared with an exponential decay with a rate of per generation. See Appendix 3—figure 28 for similar comparisons using a broad range of model parameter values.

