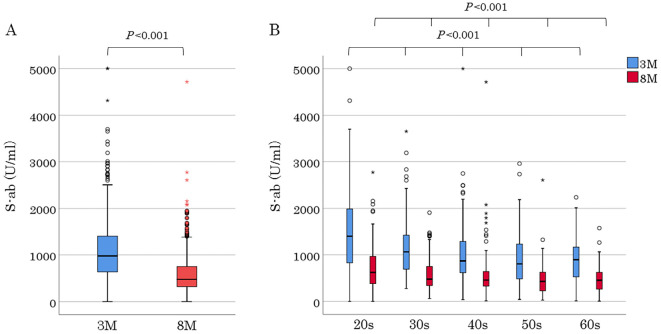
Figure 1.
S-ab levels 3 and 8 months after the second vaccination dose in all participants and participants in each generation. The top and bottom of a box represent IQR; a horizontal line, the median; and whiskers, the minimum and maximum values. Circles and asterisks represent outliers and extreme outliers, respectively. A: S-ab levels at two measurements in all participants. Undetectable S-ab levels of <0.4 (at two measurements of 1 participant) and ≥5,000 U/mL (at the first measurements of 2 participants) were imputed with 0.4 U/mL and 5,000 U/mL, respectively. B: Generational S-ab levels at two measurements. 3M: 3 months, 8M: 8 months

