Figure 5.

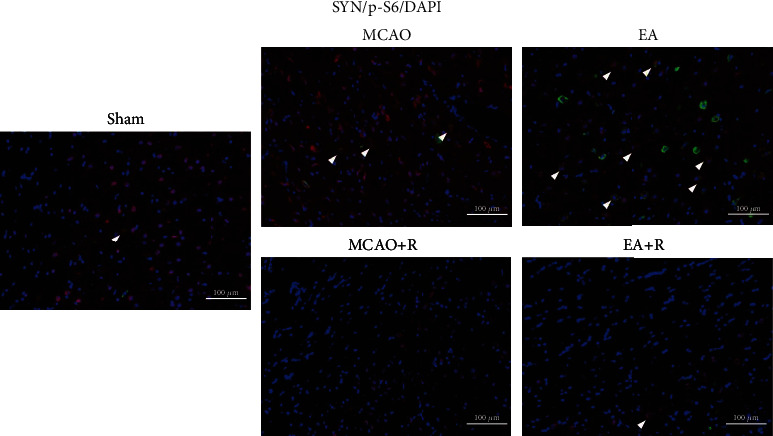
IF analysis revealed differential colocalization of p-S6+/SYN+ expression in the contralateral rat cerebral cortex. Arrows indicate positive cells, SYN (red), p-S6 (green), DAPI (blue), and co-SYN and p-S6 (yellow); scale bar = 100 μm.

IF analysis revealed differential colocalization of p-S6+/SYN+ expression in the contralateral rat cerebral cortex. Arrows indicate positive cells, SYN (red), p-S6 (green), DAPI (blue), and co-SYN and p-S6 (yellow); scale bar = 100 μm.