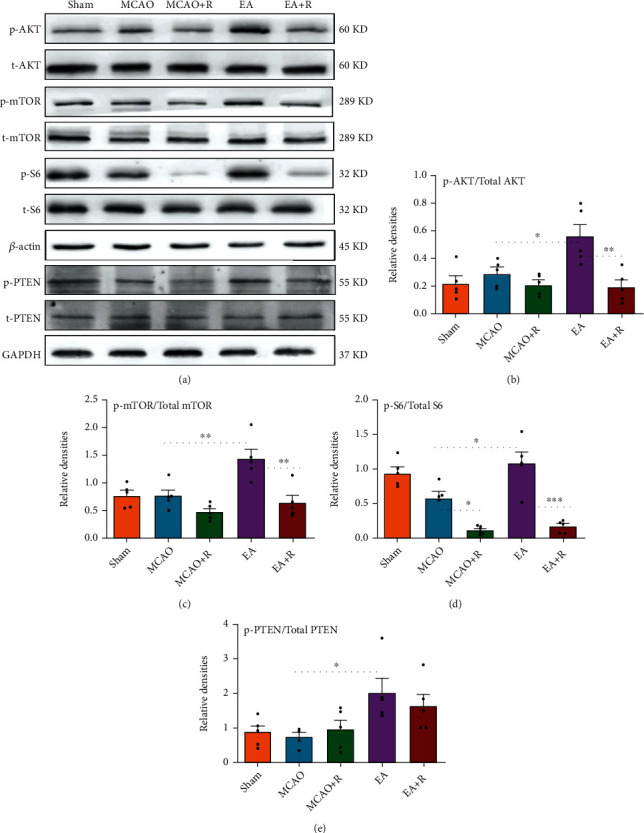
Figure 6.

Effects of EA on mTOR and PTEN pathway proteins in the robust cortex of rats with cerebral ischemic injury. (a) Western blot analysis showing the levels of p-AKT, t-AKT, p-mTOR, t-mTOR, p-S6, t-S6, p-PTEN, and t-PTEN between the sham, p-MCAO, p-MCAO + R, EA, and EA + R groups (n = 5). (b) Statistical analysis showing the levels of p-AKT/t-AKT in the cortex cerebral cortex. (c) Statistical analysis showing the levels of p-mTOR/t-mTOR in the cerebral cortex. (d) Statistical analysis showed the levels of p-S6/t-S6 in the cerebral cortex. (e) Statistical analysis showing the levels of p-PTEN/t-PTEN in the cortex cerebral cortex (∗p < 0.05, ∗∗p < 0.01, ∗∗∗p < 0.001).
