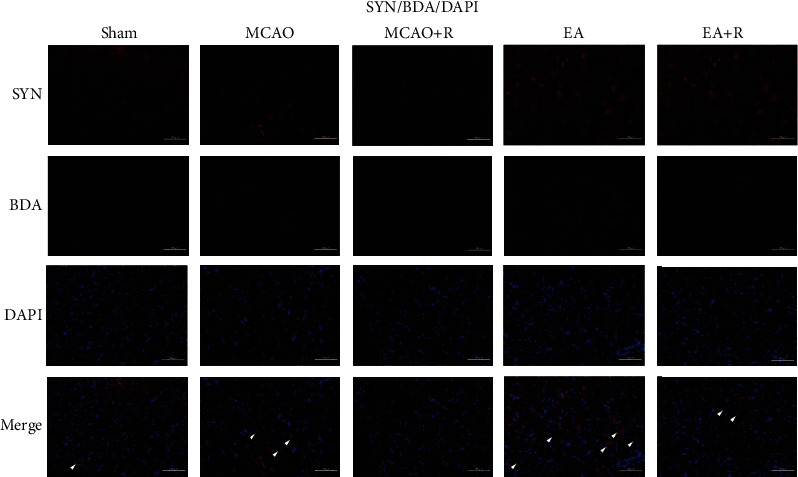
Figure 8.

The relationship between SYN and axonal sprouting in the gray matter region of the cervical medulla. Expression of BDA+/SYN+ in the cervical medullary gray matter in each group (∗p < 0.05, ∗∗p < 0.01, ∗∗∗p < 0.001, arrows indicate positive cells, BDA (green), SYN (red), DAPI (blue), and co-BDA and SYN (yellow); scale bar = 100 μm).
