
Figure 4.
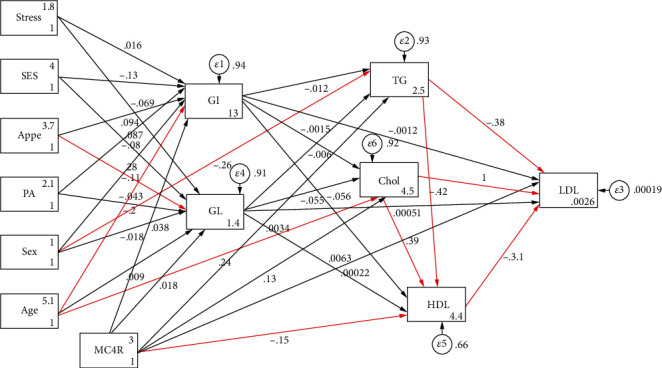
Path analysis diagram with standardized estimates illustrating the total effects of MC4R rs17782313 polymorphism, diet, sociodemographic, and psychological parameters on lipid profile among obese adults. Abbreviations: MC4R: melanocortin-4 receptor; GI: glycemic index; GL: glycemic load; SES: socioeconomic status; PA: physical activity; Appe: appetite; LDL-C: low-density lipoprotein cholesterol; HDL: high-density lipoprotein; TG: triglyceride; Chol: cholesterol. ∗All path coefficients are standardized. Red arrows mean P value ≤ 0.05. £Total effect is defined as the sum of direct and indirect effects.