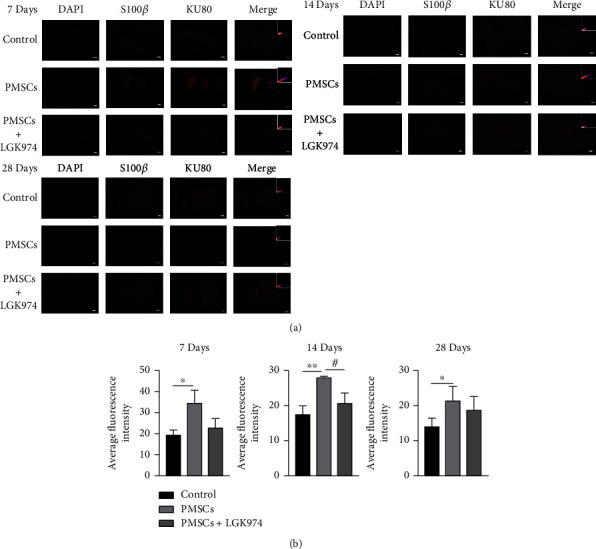
Figure 6.

Relationship between Schwann cells and PMSCs. (a) The results of immunofluorescence showed that compared with the control group S100β in the PMSC group was highly expressed at 7, 14, and 28 days after treatment (P < 0.05); the expression of S100β in the LGK974 treatment group was significantly lower than that in PMSC group on 14 days. Fluorescence colocalization showed that the expression of S100β and KU80 overlapped in the same position after PMSC treatment. (b) Quantitative measurements were expressed as mean fluorescence intensity. Data were mean ± SEM. n = 3 per each group. ∗PMSC group vs. control group, P < 0.05; #PMSC group vs. PMSC+LGK974 group, P < 0.05. The scale bar: 50 μm.
