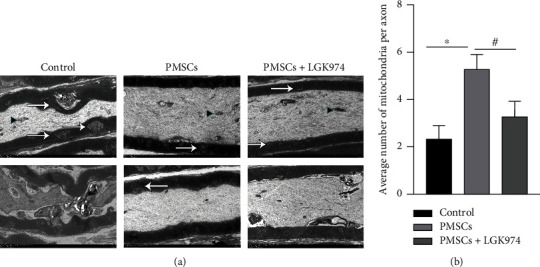
Figure 7.

After transplantation, the structure of sciatic nerve was observed under electron microscope at 28 days. (a) There were more mitochondria in the PMSC group than those in the control group and PMSC+LGK974 group (P < 0.05). The myelin sheath of the PMSC group was more complete. Black triangles indicate mitochondria, and white arrows indicate lesions. (b) Number of mitochondria per axon. Data were mean ± SEM. n = 3 independent experiment; ∗PMSC group vs. control group, P < 0.05; #PMSC group vs. PMSC+LGK974 group, P < 0.05. The scale bar: 2 μm.
