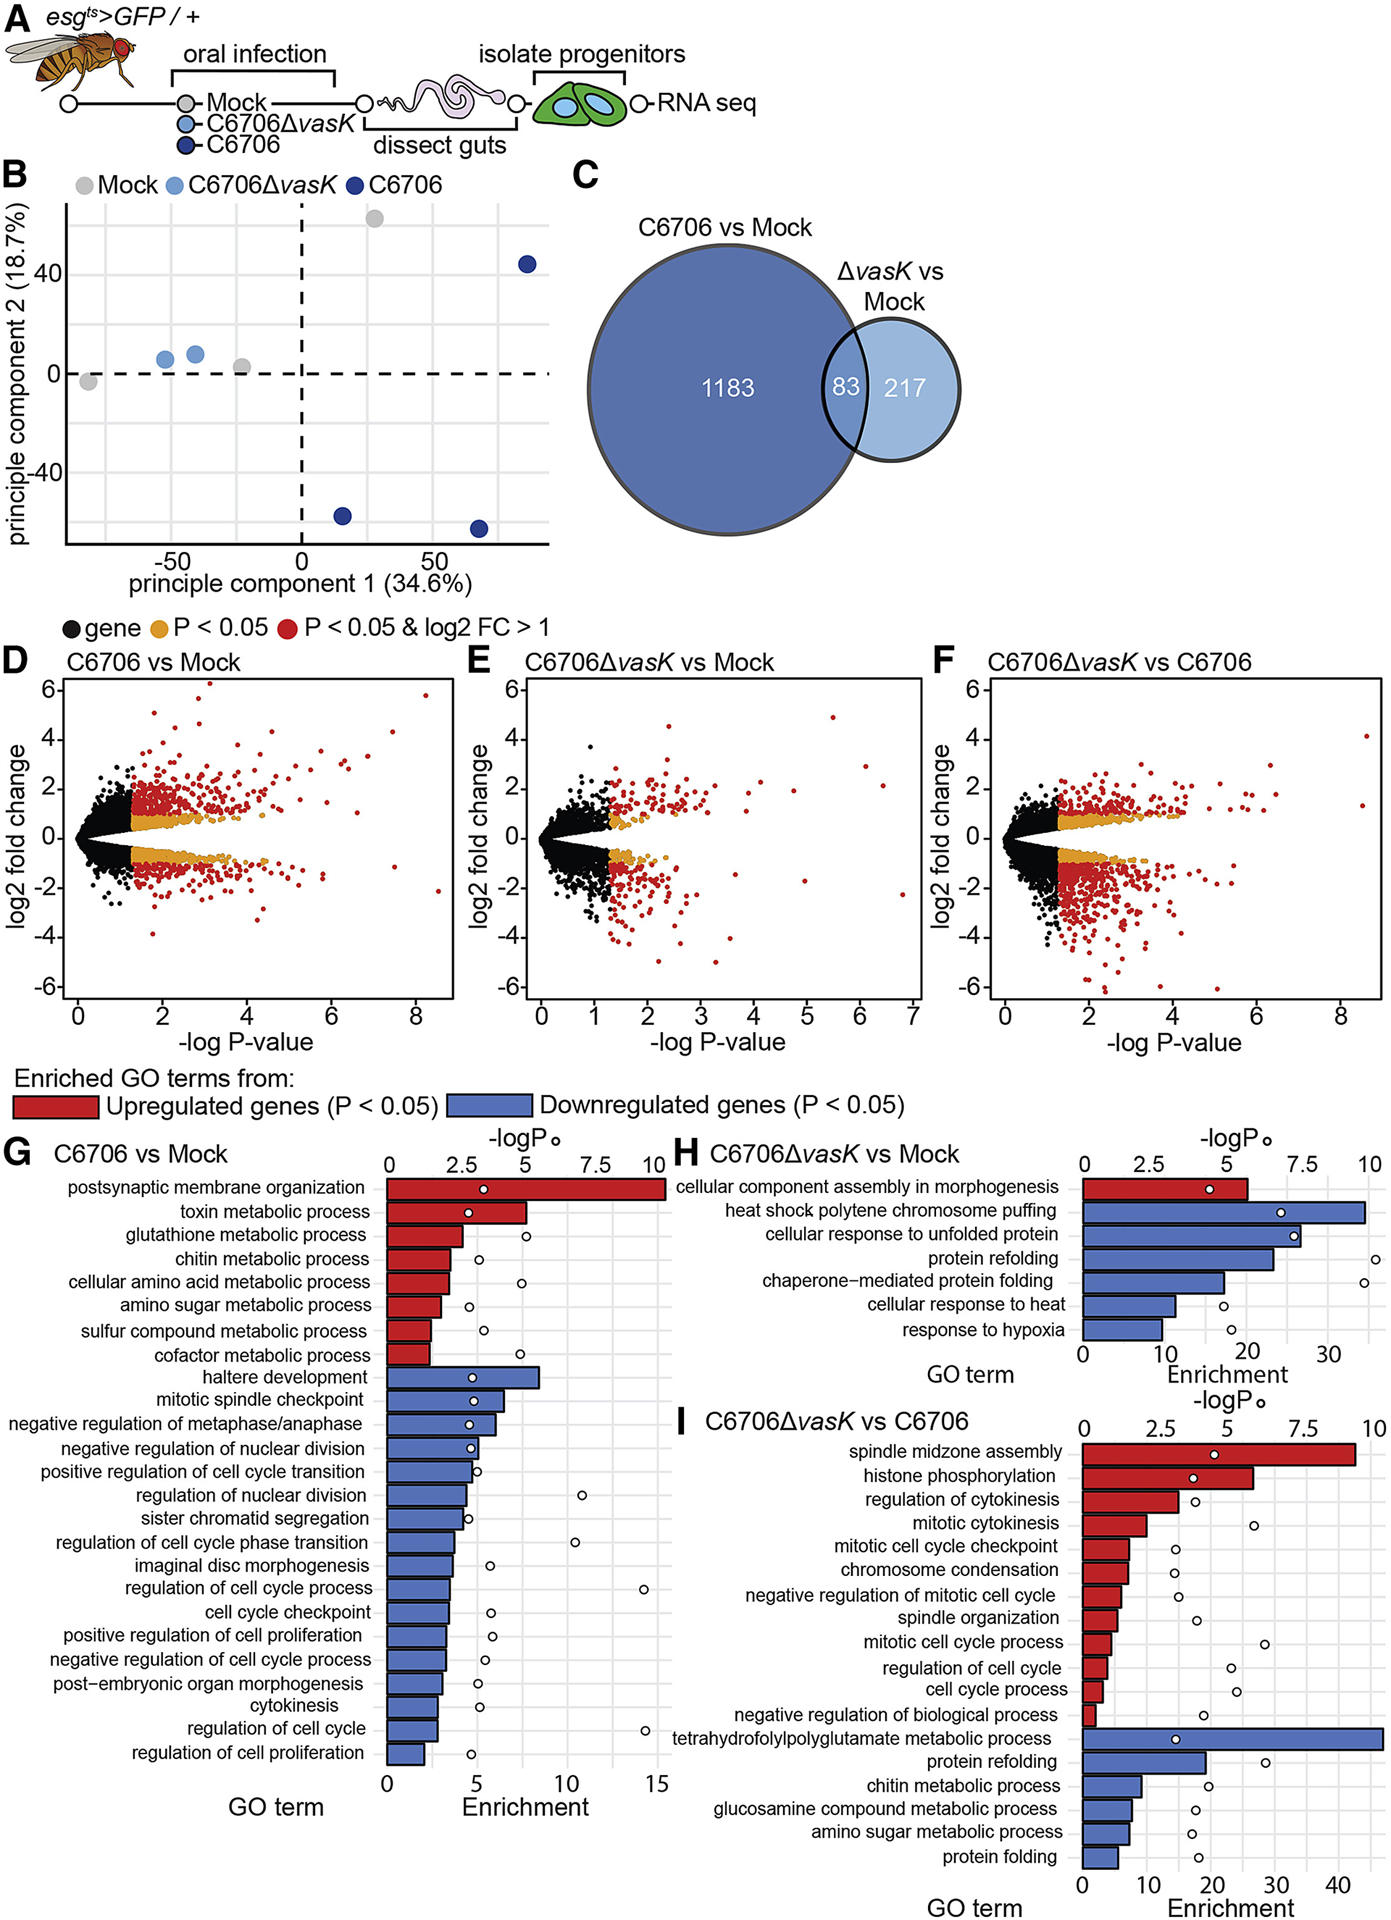
Figure 3. The T6SS modifies IPC transcriptional responses to V. cholerae.

(A) Schematic representation of the RNA-sequencing of IPCs isolated from V. cholerae infected guts. (B) Principle component analysis from the counts per million obtained from RNA-sequencing of IPCs isolated from guts mock infected or infected with C6706 or C6706ΔvasK. (C) Venn diagram of differentially expressed genes (P<0.05) from comparisons of C6706 to Mock and C6706ΔvasK to Mock. (D-F) Volcano plots of differentially expressed genes from comparisons of (D) C6706 to Mock, (E) C6706ΔvasK to Mock, and (F) C6706ΔvasK to C6706. Each dot represents a single gene. Yellow indicates a P<0.05, red indicates P<0.05 and log2 fold change >1 or <−1. (G-I) Gene Ontology analysis from up or down regulated differently expressed genes (P<0.05) from comparisons of (G) C6706 to Mock, (H) C6706ΔvasK to Mock, and (I) C6706ΔvasK to C6706. (G,H,I) Bars (bottom X-axis) represent enrichment scores and circles (top X-axis) represent −logP values for each enriched GO term.
