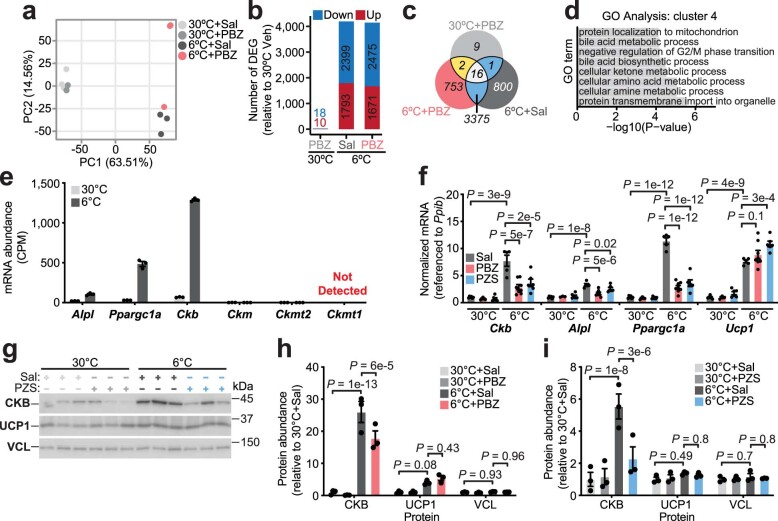
Extended Data Fig. 2. Regulation of the cold-stimulated BAT transcriptome by α-adrenergic receptor signalling.
a, Principal component analysis (PCA) of gene expression from BAT transcriptomics of Fig. 1d. Percent of variance explained by each PC is shown. Phenoxybenzamine (PBZ) and Saline (Sal). b, Barplot showing the number of down-regulated and up-regulated genes, using “30 °C + Sal” condition as baseline from BAT transcriptomics of Fig. 1d. Differentially expressed genes (DEGs) are identified using cutoffs of (log2FC > 1 and FDR < 0.01). c, Venn diagram showing the overlap of DEGs between the 30 °C + PBZ (light gray), 6 °C + Sal (dark gray) and 6 °C + PBZ (red) from BAT transcriptomics of Fig. 1d. d, GO Term enrichment of Cluster 4 genes from BAT transcriptomics of Fig. 1d. e, RNA-seq of BAT transcriptomics of Fig. 1d. CPM (counts per million). f, RT-qPCR from BAT of wild-type male mice (C57BL6/N, 6–8 weeks of age), treated as in Fig. 1d. Prazosin (PZS) was injected (3 times over 24 hours) intraperitoneally (i.p.) at 5 mg kg−1 (30 °C: n = 6 Sal, n = 3 PBZ, n = 6 PZS) (6 °C: n = 5 Sal, n = 8 PBZ, n = 6 PZS). g, Western blot of BAT from wild-type male mice (C57BL6/N, 6–8 weeks of age), reared at 22 °C, housed at 30 °C for 5 days and then subjected to 30 °C or 6 °C at ZT4. 1 hour prior to onset of 6 °C exposure (ZT3), mice were injected i.p. with PZS (5 mg kg−1, injected 3 times over 24 hours) or Sal. BAT was harvested 24 hours following 6 °C exposure (n = 3 per group). h-i, Quantification of western blots from (h) Fig. 1e (n = 3 per group) and (i) Extended Data Fig. 2g (n = 3 per group). Data are presented as mean ± s.e.m. and n numbers are of biologically independent experiments. f, One-way ANOVA (Fisher’s LSD); h, i, Two-way ANOVA (Fisher’s LSD).

