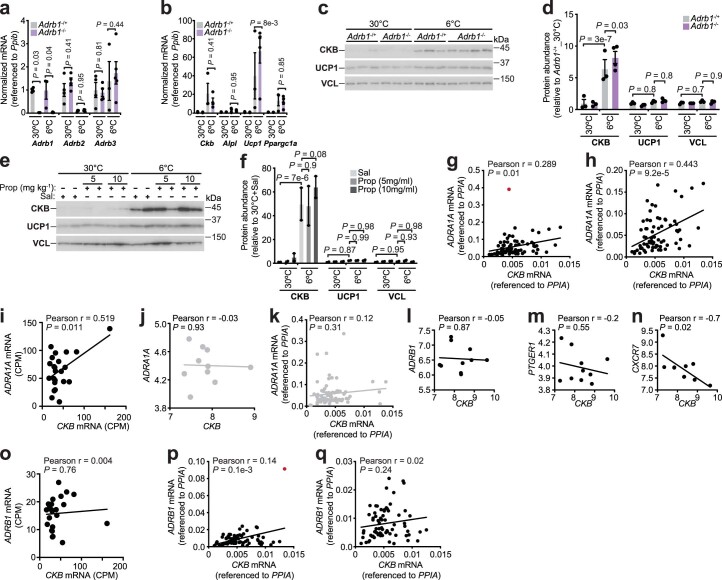
Extended Data Fig. 3. ADRA1A, not ADRB1, correlates with, CKB abundance in human BAT.
a-b, RT-qPCR analysis of BAT from Adrb1-/+ and Adrb1-/- female mice reared at 22 °C, housed at 30 °C for 5 days and then subjected to 30 °C or 6 °C at ZT4 for 24 hours (30 °C: n = 4 per genotype) (6 °C: n = 3 Adrb1-/+, n = 5 Adrb1-/-). c, Western blot from BAT of mice treated as in Extended Data Fig. 3a, b (30 °C: n = 3 per genotype) (6 °C: n = 3 Adrb1-/+, n = 4 Adrb1-/-). d, Quantification of western blots from Extended Data Fig. 3c (30 °C: n = 3 per genotype) (6 °C: n = 3 Adrb1-/+, n = 4 Adrb1-/-). e, Western blot from BAT of wild-type male mice (C57BL6/N, 6–8 weeks of age), reared at 22 °C, housed at 30 °C for 5 days and then subjected to 30 °C or 6 °C at ZT4. 1 hour prior to onset of 6 °C exposure (ZT3), mice were injected i.p. with propranolol hydrochloride (5 mg kg−1 or 10 mg kg−1) or saline (Sal). BAT was harvested 24 hours following 6 °C exposure (n = 2 per group). f, Quantification of western blots from Extended Data Fig. 3e (n = 2 per group). g, Pearson correlation of CKB with ADRA1A mRNA in human BAT (n = 73), third cohort. Red data point indicates outlier based on ROUT method (Q = 0.1%). h, Pearson correlation with outlier identified in Extended Data Fig. 3g removed. i, Pearson correlation of CKB with ADRA1A mRNA in human BAT (supraclavicular adipose tissue) (n = 23), second cohort. j, k, Pearson correlation of CKB with ADRA1A mRNA in (j) human SAT (superficial subcutaneous adipose tissue) (n = 10), first cohort and (k) human SAT (superficial neck adipose tissue) (n = 73), third cohort. l-n, Pearson correlation of CKB with (l) ADRB1, (m) PTGER1 and (n) CXCR7 mRNA in human BAT (adipose tissue proximal to carotid sheath) (n = 10), first cohort. o, Pearson correlation of CKB with ADRB1 mRNA in human BAT (supraclavicular adipose tissue) (n = 23), second cohort. p, Pearson correlation of CKB with ADRB1 mRNA in human BAT (n = 73), third cohort. Red data point indicates outlier based on ROUT method (Q = 0.1%). q, Pearson correlation with outlier identified in Extended Data Fig. 3p removed. Data are presented as mean ± s.e.m. and n numbers are of biologically independent experiments. a, b, d, f, Two-way ANOVA (Fisher’s LSD); g-q, Pearson correlation (two-sided).

