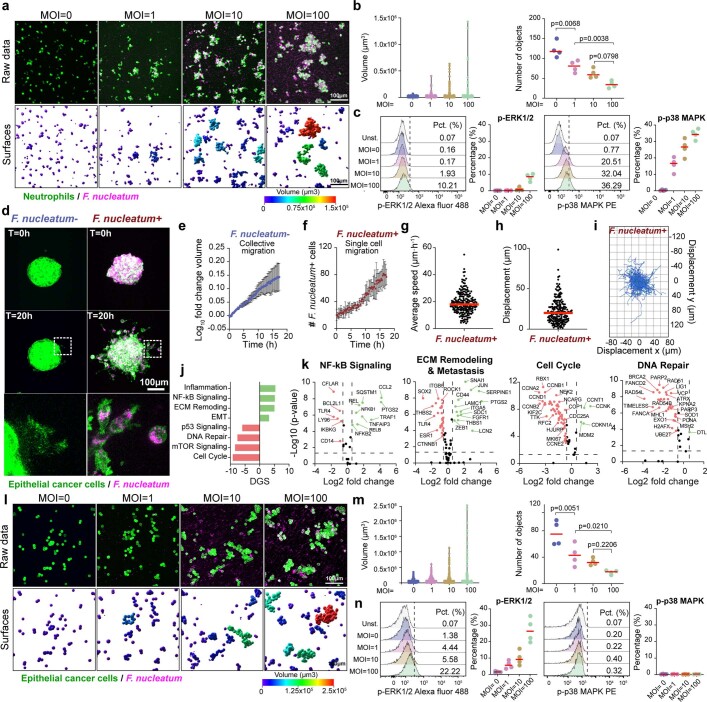
Extended Data Fig. 9. F. nucleatum induces the formation of cell clusters in immune and cancer cells.
a, Confocal images showing cluster formation of differentiated neutrophils derived from human HL-60 cells (green) co-cultured with F. nucleatum (pink) at different multiplicity of infection (MOI). Top micrographs display the raw imaging data. Bottom micrographs display the corresponding mask surfaces for each experimental condition by using Imaris software. Colour bar indicates the size (volume µm3) of the objects. b, Left: Violin plot indicates the quantification of volume of individual neutrophil clusters (data points) in the present of F. nucleatum as shown in (a); combined data from 4 independent experiments. Right: Dot plot shows the number of neutrophil clusters (objects) per field of view as indicated in (a). Data points represent the number of cell objects for each independent experiment (n = 4). p-values were calculated by one-way ANOVA followed by Bonferroni multiple comparison test. c, Flow cytometry plots show the levels of phosphorylation of ERK and p38 MAPK in neutrophils treated with F. nucleatum. Corresponding dot plots indicate the level of phosphorylation for each independent experiment (data points; n = 4). d, Spheroids derived from a mouse CRC cell line CT26WT were treated with or without F. nucleatum for 12 h and then embedded in collage matrices. The cell invasion capabilities for both conditions were evaluated using live-cell confocal imaging over a period of 19 h. Amplified images show the difference in the migration mode from both conditions. e, Log10 fold change volume over time of uninfected CRC spheroids revealing the expansion rate of uninfected control spheroids. Data points indicate the average values from three independent experiments. Error bars indicate the standard deviation (SD). f, Number of F. nucleatum-positive cancer cells that detached from the spheroid mass as single motile cells from three independent experiments. Errors bars indicate the SD. g-h, Distribution of the average speed and cell displacements of single cells that escape the spheroid mass infected with F. nucleatum. Combined data from three independent experiments. Red bars indicate the mean. Data points represents individual tracks; “n” indicates number of tracks per condition. i, Cell trajectories from an origin point of invading cancer cells that escape the spheroids infected with F. nucleatum. j, Signalling pathway analysis of CRC spheroids infected with F. nucleatum in comparison to uninfected control spheroids. k, Volcano plots showing the regulation of genes in selected signalling pathways in spheroids infected with F. nucleatum in comparison to uninfected spheroids. Dashed lines indicate the threshold of significant gene expression defined as the Log2 fold change ≤−0.58 and ≥0.58 with a -Log10 p value ≥1.301 following LMM analysis and Benjamini–Hochberg multiple-correction testing. l, Confocal images showing cell cluster formation of cancer cells derived from the human cell line HCT116 treated with F. nucleatum at different MOI as it is indicated. m, Left: Violin plot indicates the quantification of volume of individual cancer cell clusters (data points) in the present of F. nucleatum as shown in (l); combined data from 4 independent experiments. Right: Dot plot shows the number of cancer cell objects per field of view as indicated in (l). Data points represent the number of clusters for each independent experiment (n = 4). p-values were calculated by one-way ANOVA followed by Bonferroni multiple comparison test. n, Flow cytometry plots show the levels of phosphorylation of ERK and p38 MAPK in cancer cells treated with F. nucleatum. Corresponding dot plots indicate the level of phosphorylation for each independent experiment (data points; n = 4).

