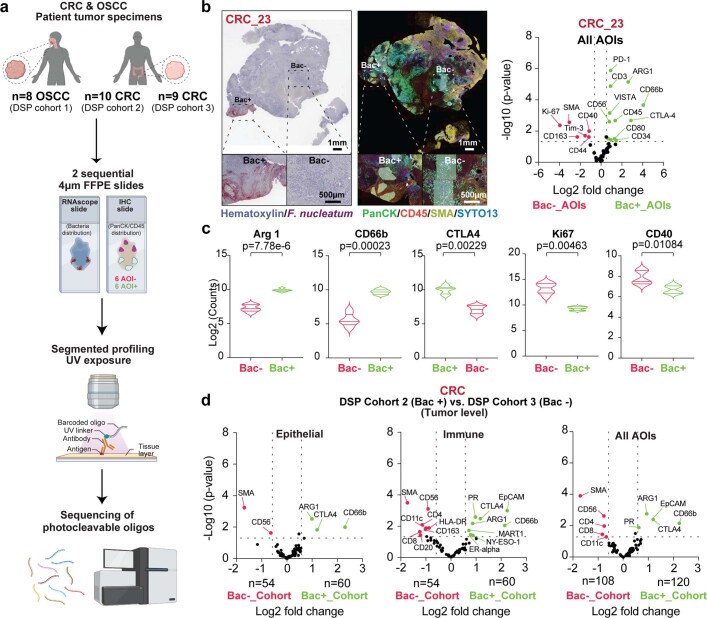
Extended Data Fig. 2. The tumour-associated microbiota resides in highly immunosuppressive microniches with a low proliferation rate.
a, Experimental approach: GeoMx DSP was implemented to assess bacteria-associated microniches in one OSCC DSP cohort (n = 8) and two CRC DSP cohorts (RNAscope bacteria-positive cohort n = 10 and RNAscope bacteria-negative cohort n = 9). Sequential 4 µm-FFPE slides were prepared to identify spatial bacterial tumour distribution (RNAscope-CISH using F. nucleatum and eubacteria probes) and immunohistochemistry for immune (CD45+) and epithelial (PanCK+) compartments on the DSP slide treated with the 77-antibody panel. Segmented profiling for CD45+ and PanCK+ was performed on bacteria-positive AOIs (AOI_bac+) and bacteria-negative AOIs (AOI_bac-) per specimen, releasing photocleavable barcoded oligos for sequencing. Sequenced oligos provided the spatial information of the respective protein target in the bacteria positive or negative regions. b, RNAscope-CISH (left) showing the distribution of F. nucleatum (dark red), throughout the tumour tissue from a CRC specimen. A sequential slide (right) showed the distribution of the immune (CD45+; red) and epithelial (PanCK+; green) compartments by IHC staining. Inset images indicated the AOIs that were selected for DSP analysis from a bacteria-positive (Bac+) and bacteria-negative (Bac-) regions as it is indicate. Volcano plot showed the differential expression of genes from a single CRC sample comparing Bac+ with Bac- regions from the same tissue sample. Dashed lines indicate the threshold of significant gene expression defined as the Log2 fold change ≥0.58 and ≤−0.58 with a -Log10 p value ≥1.301 following LMM analysis and Benjamini–Hochberg multiple-correction testing. A 52-antibody panel were included here (this did not include the Cell Death and MAPK modules applied to DSP cohorts 1—3). c, Violin plots demonstrate the immuno‑suppressive microenvironment in bacteria-positive regions (Bac+) from the sample described in (b), highlighting the upregulation of ARG1 and CTLA4 and the enrichment of myeloid CD66b+ cells with lower expression of Ki67 and the T cell co-stimulatory molecule CD40 compared to bacteria-negative regions. p values calculated by t-test. d, Volcano plots indicate the differential gene-expression profile using the GeoMx DSP platform comparing AOIs from tumours (DSP cohort 2) that were RNAscope bacteria positive (Bac+; n = 120) against AOIs from tumours (DSP cohort 3) that were RNAscope bacteria negative (Bac-; n = 108). Using segmented analysis, the barcode oligos were collected either from the immune (CD45+) segment, epithelial (PanCK+) segment or both (All AOIs). Dashed lines indicate the threshold of significant gene expression defined as the Log2 fold change ≥0.58 and ≤−0.58 with a -Log10 p value ≥1.301 following LMM analysis and Benjamini–Hochberg multiple-correction testing.

