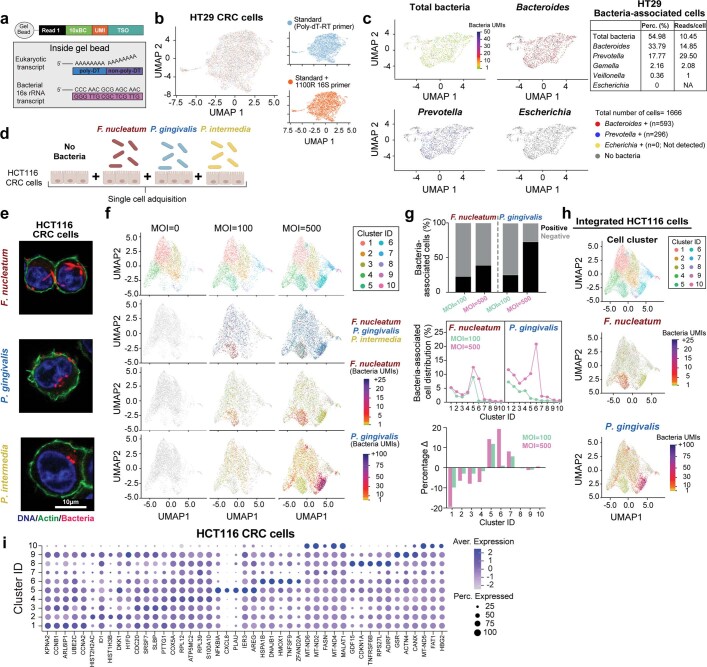
Extended Data Fig. 4. Detection of bacteria-associated single cells using the INVADEseq technique.
a, Schematic showing a modified gel bead emulsion (GEMs) by introducing a primer (1100R 16S) that targets a conserved region of the bacterial 16S rRNA, thus allowing cDNA generation of bacterial transcripts from the associated human single cells. In addition to the standard 10x genomics 5’ library preparation, bacterial cDNA was amplified with a nested conserved 16S rRNA gene primer and size selected libraries were sequenced and assessed through GATK PathSeq to identify bacterial taxa. Sequencing reads from the 16S rRNA amplified libraries retain the 10x genomics barcode sequence which facilitated mapping of annotated bacterial reads directly to the host single cells they are associated with. b, UMAP plots showing single-cell transcriptome of HT-29 cells with (orange dots) and without (blue dots) the 1100R 16S primer in the amplification mix before single-cell cDNA generation. UMAP plot inserts show the transcriptome for each condition, indicating no differences in the human gene-expression profile when the 1100R 16S primer was added. c, UMAP plots indicating single-cell transcriptome of HT-29 cells co-incubated with Bacteroides fragilis, Prevotella intermedia, Gemella haemolysans, Veillonella parvula and Escherichia coli DH5a for 3 h at MOI = 100. Insert table indicates the percentage of bacteria-associated single cells and total bacterial reads per cell per bacterial taxa. Note: Escherichia coli DH5a reads were not detected in human single cells. d, Experimental approach: HCT116 cancer cells were co-culture with either Fusobacterium nucleatum, Porphyromonas gingivalis or Prevotella intermedia at total multiplicity of infection (MOI) of 0, 100 and 500 for 3 hrs and processed for INVADEseq. e, Confocal images showing intracellular bacteria in HCT116 cancer cells after 3 h of incubation with F. nucleatum, P. gingivalis and P. intermedia as it is indicated. f, From top to bottom, UMAP plots from scRNA-seq data showing: Cell cluster distribution based on epithelial cell transcription, infected HCT116 cancer cells with F. nucleatum, P. gingivalis and P. intermedia, and expression level (UMI, bacterial load) of F. nucleatum and P. gingivalis transcripts in cancer cells following bacteria treatment for 3 h at multiplicity of infection (MOI) 0, 100 and 500 as it is indicated. Cluster ID indicates a unique transcriptional cellular group predicted by Seurat package (See methods). Colour bars indicate the expression level (UMI counts) of F. nucleatum and P. gingivalis transcripts as it is indicated. g, Top: Percentage of bacteria-associated cells positive for either F. nucleatum or P. gingivalis at MOI = 100 and 500 as it is indicated. Middle: Distribution of F. nucleatum and P. gingivalis-associated cells across all cell cluster annotated in (f) whereby all cell clusters combined, bacteria positive and negative, equal 100%. Bottom: Relative change in the percentages (Δ%) of cancer epithelial cell clusters between bacteria-associated cancer cells at MOI = 100 or 500 compared to the untreated control cell population (MOI = 0) for each cancer cell cluster annotated in (f). h, UMAP plots showing cancer epithelial cell clusters and detection of F. nucleatum and P. gingivalis transcripts following data integration from the experimental conditions described in (d). i, Dot plot showing the relative expression of gene markers for each ID cluster from CRC epithelial cells derived from the HCT116 cell line. Colour bars indicate the average expression level, and the dots represent the percentage expression level for each gene marker.

