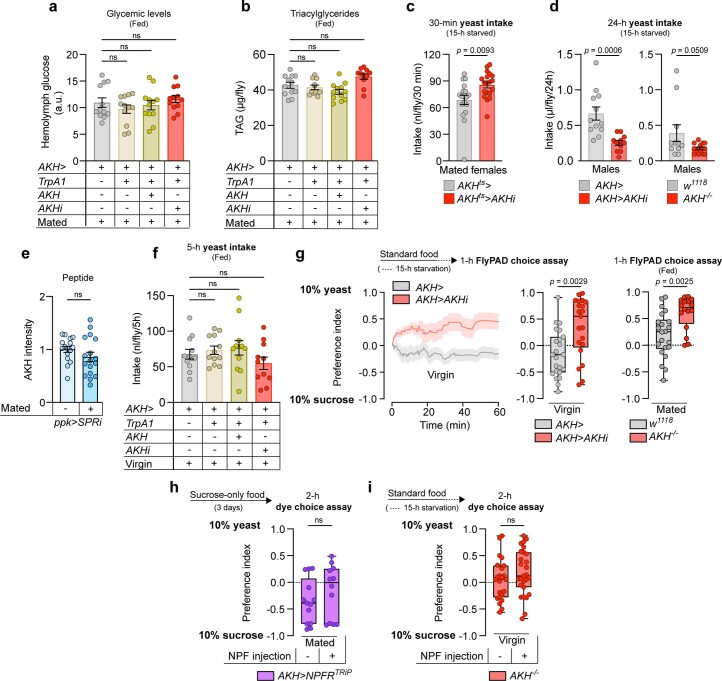
Extended Data Fig. 6. Alteration of AKH signaling leads to increased yeast intake in females, not males, without metabolic effects, indicating sexual dimorphism in AKH effects on feeding preferences.
(a,b). Hemolymph glucose and TAG levels in mated females at 29 °C for TrpA1 activation; (a) all n = 12, (b) n = 12 AKH > , n = 11 AKH > TrpA1, n = 12 AKH > TrpA1 + AKH, n = 11 AKH > TrpA1 + AKHi. (c) Yeast consumption measured by dye assay in mated female flies; n = 18 AKHts > , n = 19 AKHts > AKHiKK. (d) Yeast intake of males measured over 24 hours by CAFÉ assay. Left panel, AKH knockdown; right panel, AKH mutant; n = 12 AKH > , n = 11 AKH > AKHiKK, n = 11 w1118, n = 15 AKH-/-. (e) AKH staining intensity in virgin and mated females with SPR knockdown in the ppk+ neurons; n = 16 ppk > SPRi virgins, n = 17 ppk > SPRi mated females. Note that animals were injected with hemolymph-like buffer without NPF peptide. (f) Yeast consumption measured in fed virgin females using dye assay, at 29 °C for TrpA1 activation; n = 12 AKH > , n = 12 AKH > TrpA1, n = 12 AKH > TrpA1 + AKH, n = 11 AKH > TrpA1 + AKHi). (g) Cumulative behavioural preference of virgin females after 15 hours of starvation or of fed mated females using flyPAD. Lines represent the mean and shading indicates SEM. Virgins: n = 23 AKH > , n = 21 AKH > AKHiKK. Mated females: n = 22 w1118, n = 16 AKH-/-. (h,i) Injection of NPF peptide into the hemolymph of 3-days-yeast-deprived mated females with NPFR knockdown in the APCs (h) or 15-h starved AKH mutant virgin females (i) using two-choice dye assay; n = 13 AKH > NPFRiTRiP, n = 12 AKH > NPFRiTRiP with NPF injection, n = 23 AKH-/-, n = 27 AKH-/- with NPF injection. Bars represent mean±SEM. Box plots indicate minimum, 25th percentile, median, 75th percentile, and maximum values. ns, non-significant. a, b, f: One-way ANOVA with Tukey’s multiple-comparisons test. c, e, g, h, i: Two-tailed unpaired Mann-Whitney U test. d: Two-tailed unpaired Student’s t test.

