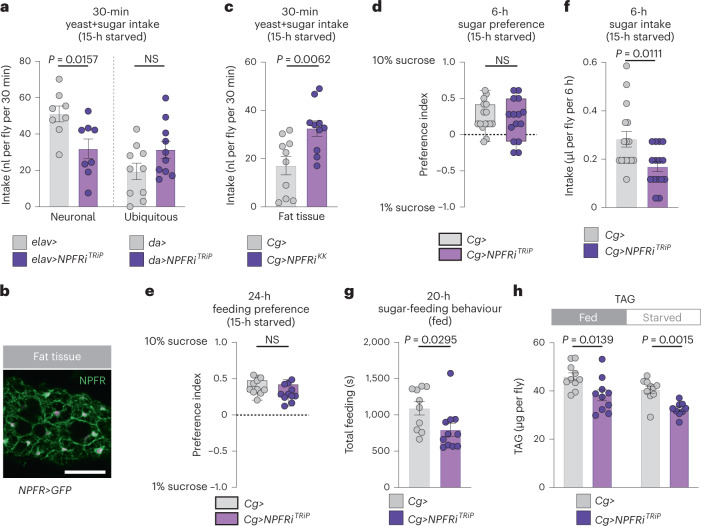
Fig. 5. Loss of NPFR in the fat affects metabolism but does not increase preference for dietary sugar in mated females.
a, Food intake measured by dye in animals with knockdown of NPFR in the nervous system (elav>) or the entire body (da>) measured by dye assay; n = 8 elav>, n = 8 elav>NPFRiTRiP, n = 10 da>, n = 10 da>NPFRiTRiP. b, Fat-body immunostaining of NPFR>mCD8::GFP reporter. Scale bar, 50 μm c, Food intake determined by dye assay in fat-body NPFR-knockdown animals; both n = 10. d, Consumption preference for 1 versus 10% sucrose, measured by CAFÉ assay; n = 16 Cg>, n = 15 Cg>NPFRiTRiP. e, Behavioural preference for interacting with 1 versus 10% dietary sucrose measured by FLIC; n = 10 Cg>, n = 11 Cg>NPFRiTRiP. f, Sucrose intake by CAFÉ assay; n = 16 Cg>, n = 15 Cg>NPFRiTRiP. g, Time spent feeding on sucrose using FLIC; n = 10 Cg>, n = 11 Cg>NPFRiTRiP. h, Whole-body TAG levels in fed and 15-hour-starved fat-body NPFR-knockdown animals. All n = 10 except n = 9 starved Cg>NPFRiTRiP. All animals were mated females. Bars represent mean ± s.em. Box plots indicate minimum, 25th percentile, median, 75th percentile and maximum values. NS, not significant. a,c–e,h (left), Two-tailed unpaired Student’s t-test. f–h (right), Two-tailed unpaired Mann–Whitney U-test.

