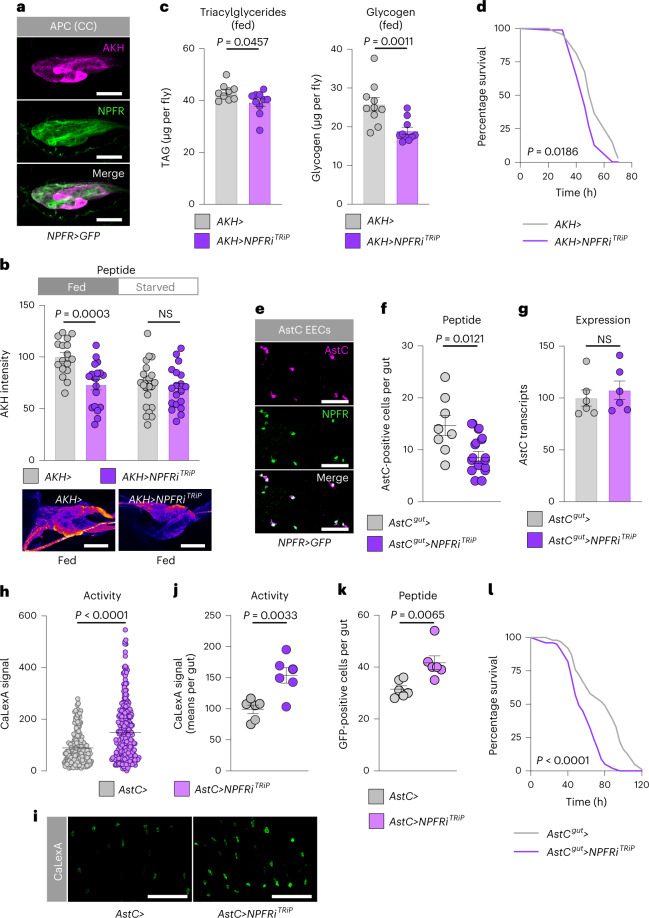
Fig. 6. NPFR regulates metabolism through inhibition of AKH signalling in mated females.
a, Immunohistochemistry of APCs shows NPFR>GFP reporter expression in APCs of mated females. Scale bars 20 μm. b, Quantification of AKH levels within the APCs of fed and 15-hour-starved mated females with and without NPFR knockdown in these cells; n = 17 fed AKH>, n = 19 fed AKH>NPFRiTRiP, n = 22 starved AKH>, n = 19 starved AKH>NPFRiTRiP. Representative images are shown below. Scale bars 20 μm. c, Metabolite levels in fed mated females. TAG n = 9 AKH>, n = 10 AKH>NPFRiTRiP; glycogen n = 10 AKH>, n = 10 AKH>NPFRiTRiP. d, Survival during starvation of mated females; n = 96 AKH>, n = 96 AKH>NPFRiTRiP. e, Immunohistochemistry of guts from mated female NPFR>GFP flies showing expression of NPFR reporter in AstC+ cells. Scale bars, 25 μm. f, Quantification of the number of midgut cells per gut that showed detectable AstC staining with and without NPFR knockdown in AstC+ EECs of fed mated females; n = 8 AstCgut> guts, n = 11 AstCgut>NPFRiTRiP. g, Midgut AstC transcript levels in fed mated females; each n = 6. h–k, AstC+ EEC-cell activity levels (h) with representative images (i) quantified on a per-gut basis (j) and the number of AstC+ EEC cells showing detectable GFP (k), measured by calcium-reporter system (AstC>LexA::NFAT::VP16; LexAop-GFP, denoted by AstC> in the figure) with or without NPFR knockdown in the AstC+ EECs in the midgut. h, n = 182 AstC> cells, n = 255 AstC>NPFR cells; j, each n = 6 guts; k, each n = 6 guts. Scale bars, 50 μm. l, Survival during starvation of mated females; n = 153 AstCgut> animals, n = 198 AstCgut>NPFRiTRiP. All animals were mated females. Bars represent mean ± s.e.m. Box plots indicate minimum, 25th percentile, median, 75th percentile and maximum values. NS, not ignificant. b,c (left), f,g,j, Two-tailed unpaired Student’s t-test. d,l, Gehan–Breslow–Wilcoxon test. c (right), h,k, Two-tailed unpaired Mann–Whitney U-test.

