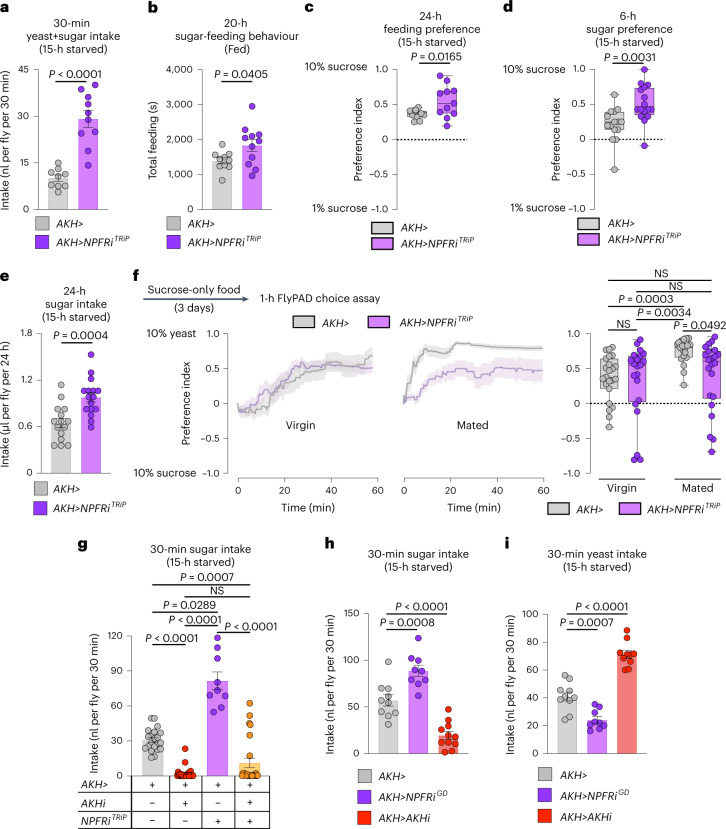
Fig. 7. Loss of NPFR in the APCs phenocopies the gut NPF-loss feeding phenotypes in mated females.
a, Food intake measured by dye assay; n = 9 AKH>, n = 10 AKH>NPFRiTRiP. b, Time spent feeding on sucrose measured by FLIC; n = 10 AKH>, n = 11 AKH>NPFRiTRiP. c, Behavioural preference for 1 versus 10% sugar solution measured by FLIC; both n = 11. d, Consumption preference for 1 versus 10% sucrose measured by CAFÉ assay; n = 15 AKH>, n = 16 AKH>NPFRiTRiP. e, Sucrose consumption measured by CAFÉ assay; n = 15 AKH>, n = 16 AKH>NPFRiTRiP. f, Behavioural preference using flyPAD. Lines represent means, and shading indicates s.e.m.; virgins n = 23 AKH>, n = 21 AKH>NPFRiTRiP; mated n = 19 AKH>, n = 22 AKH>NPFRiTRiP. g, Rescue of sugar overconsumption induced by NPFR knockdown in the APCs through simultaneous AKH knockdown, by dye assay; n = 21 AKH>, n = 24 AKH>AKHiKK, n = 9 AKH>NPFRiTRiP, n = 24 AKH>AKHiKK, NPFRiTRiP. h,i, Sucrose (h) and yeast (i) intake measured over 30 min by dye assay. h, n = 10 AKH>, n = 9 AKH>NPFRiGD, n = 11 AKH>AKHiKK. i, n = 10 AKH>, n = 9 AKH>NPFRiGD, n = 10 AKH>AKHiKK. All animals were mated females, except in f. Bars represent mean ± s.e.m. Box plots indicate minimum, 25th percentile, median, 75th percentile and maximum values. NS, not significant. a–d, Two-tailed unpaired Student’s t-test. e, Two-tailed unpaired Mann–Whitney U-test. f,g, One-way Kruskal–Wallis ANOVA with Dunn’s multiple-comparisons test. h,i, One-way ANOVA with Dunnett’s multiple-comparisons test.

