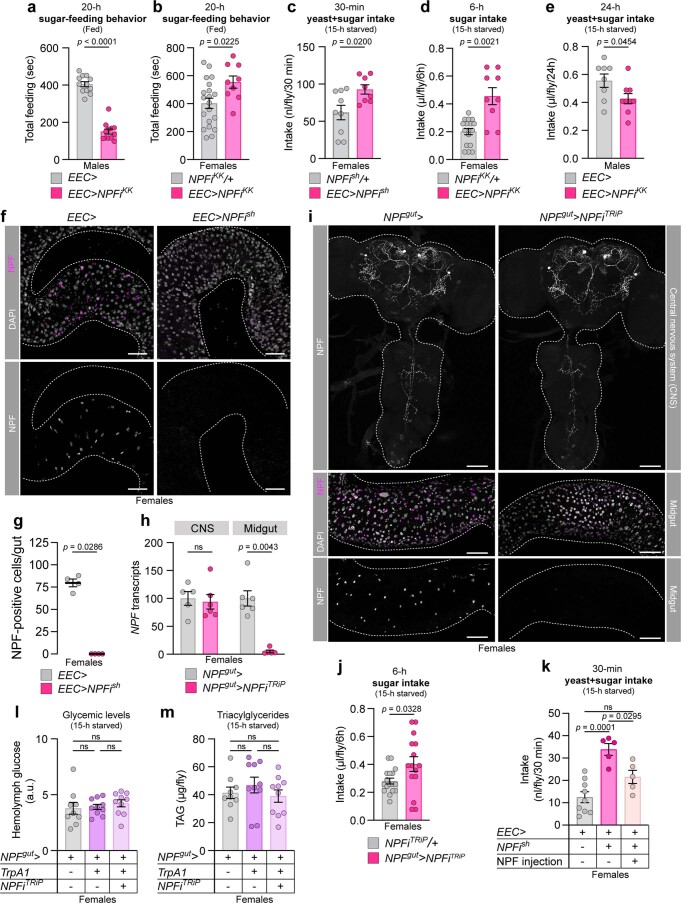
Extended Data Fig. 1. NPF knockdown efficiently depletes NPF specifically in the midgut EECs and affects food intake.
(a) Total time feeding using FLIC; n = 12. (b) Time spent feeding determined by FLIC; n = 20 NPFiKK/+, n = 9 EEC > NPFiKK. (c) Amount of sugar+yeast solid food (9% sugar + 8% yeast) consumed, by dye assay; n = 9 NPFish/+; n = 8 EEC > NPFish. (d) Consumption of 10% sugar measured by CAFÉ assay; n = 17 NPFiKK/+ and n = 9 EEC > NPFiKK. (e) Consumption of sugar+yeast liquid food (5% sugar + 5% yeast extract) measured by CAFÉ assay; n = 8 EEC > , n = 9 EEC > NPFiKK. (f,g) NPF immunostaining in the midgut of mated females, quantified in (g); n = 4 guts. Scale bars, 50 μm. (h) Knockdown using the R57C10-GAL80, NPF > (NPFgut > ) driver with NPFiTRiP affects NPF transcripts in mated female guts but not the CNS (brain and ventral nerve cord), n = 5 NPFgut > CNS samples, n = 6 NPFgut > NPFiTRiP CNS samples, n = 6 NPFgut > midgut samples, n = 5 NPFgut > NPFiTRiP midgut samples, each replicate containing tissues from 6 animals. (i) NPF immunostaining of CNS and midguts from mated females, quantified in Fig. 1 h. Scale bars, 50 μm. (j) Consumption of 10% sugar-water measured by CAFÉ assay; n = 17 NPFiTRiP/+, n = 15 NPFgut > NPFiTRiP. (k) Food intake after injection of NPF peptide into the haemolymph measured by dye assay; n = 9 EEC > , n = 5 EEC > NPFish, n = 5 EEC > NPFish with NPF injection. (l,m) Hemolymph glucose (l) and whole-body TAG (m) levels after 30-minute incubation at 29 °C for TrpA1 activation; n = 9 NPFgut > , n = 10 NPFgut > TrpA1, n = 10 NPFgut > TrpA1 + NPFi. All females were mated. Bars represent mean±SEM. ns, non-significant. a, b, c, e, j: Two-tailed unpaired Student’s t test. d, g, h: Two-tailed unpaired Mann–Whitney U test. k: One-way ANOVA with Tukey’s multiple-comparisons test. l, m: Kruskal-Wallis nonparametric ANOVA with Dunn’s multiple-comparisons test.

