
Figure 3:
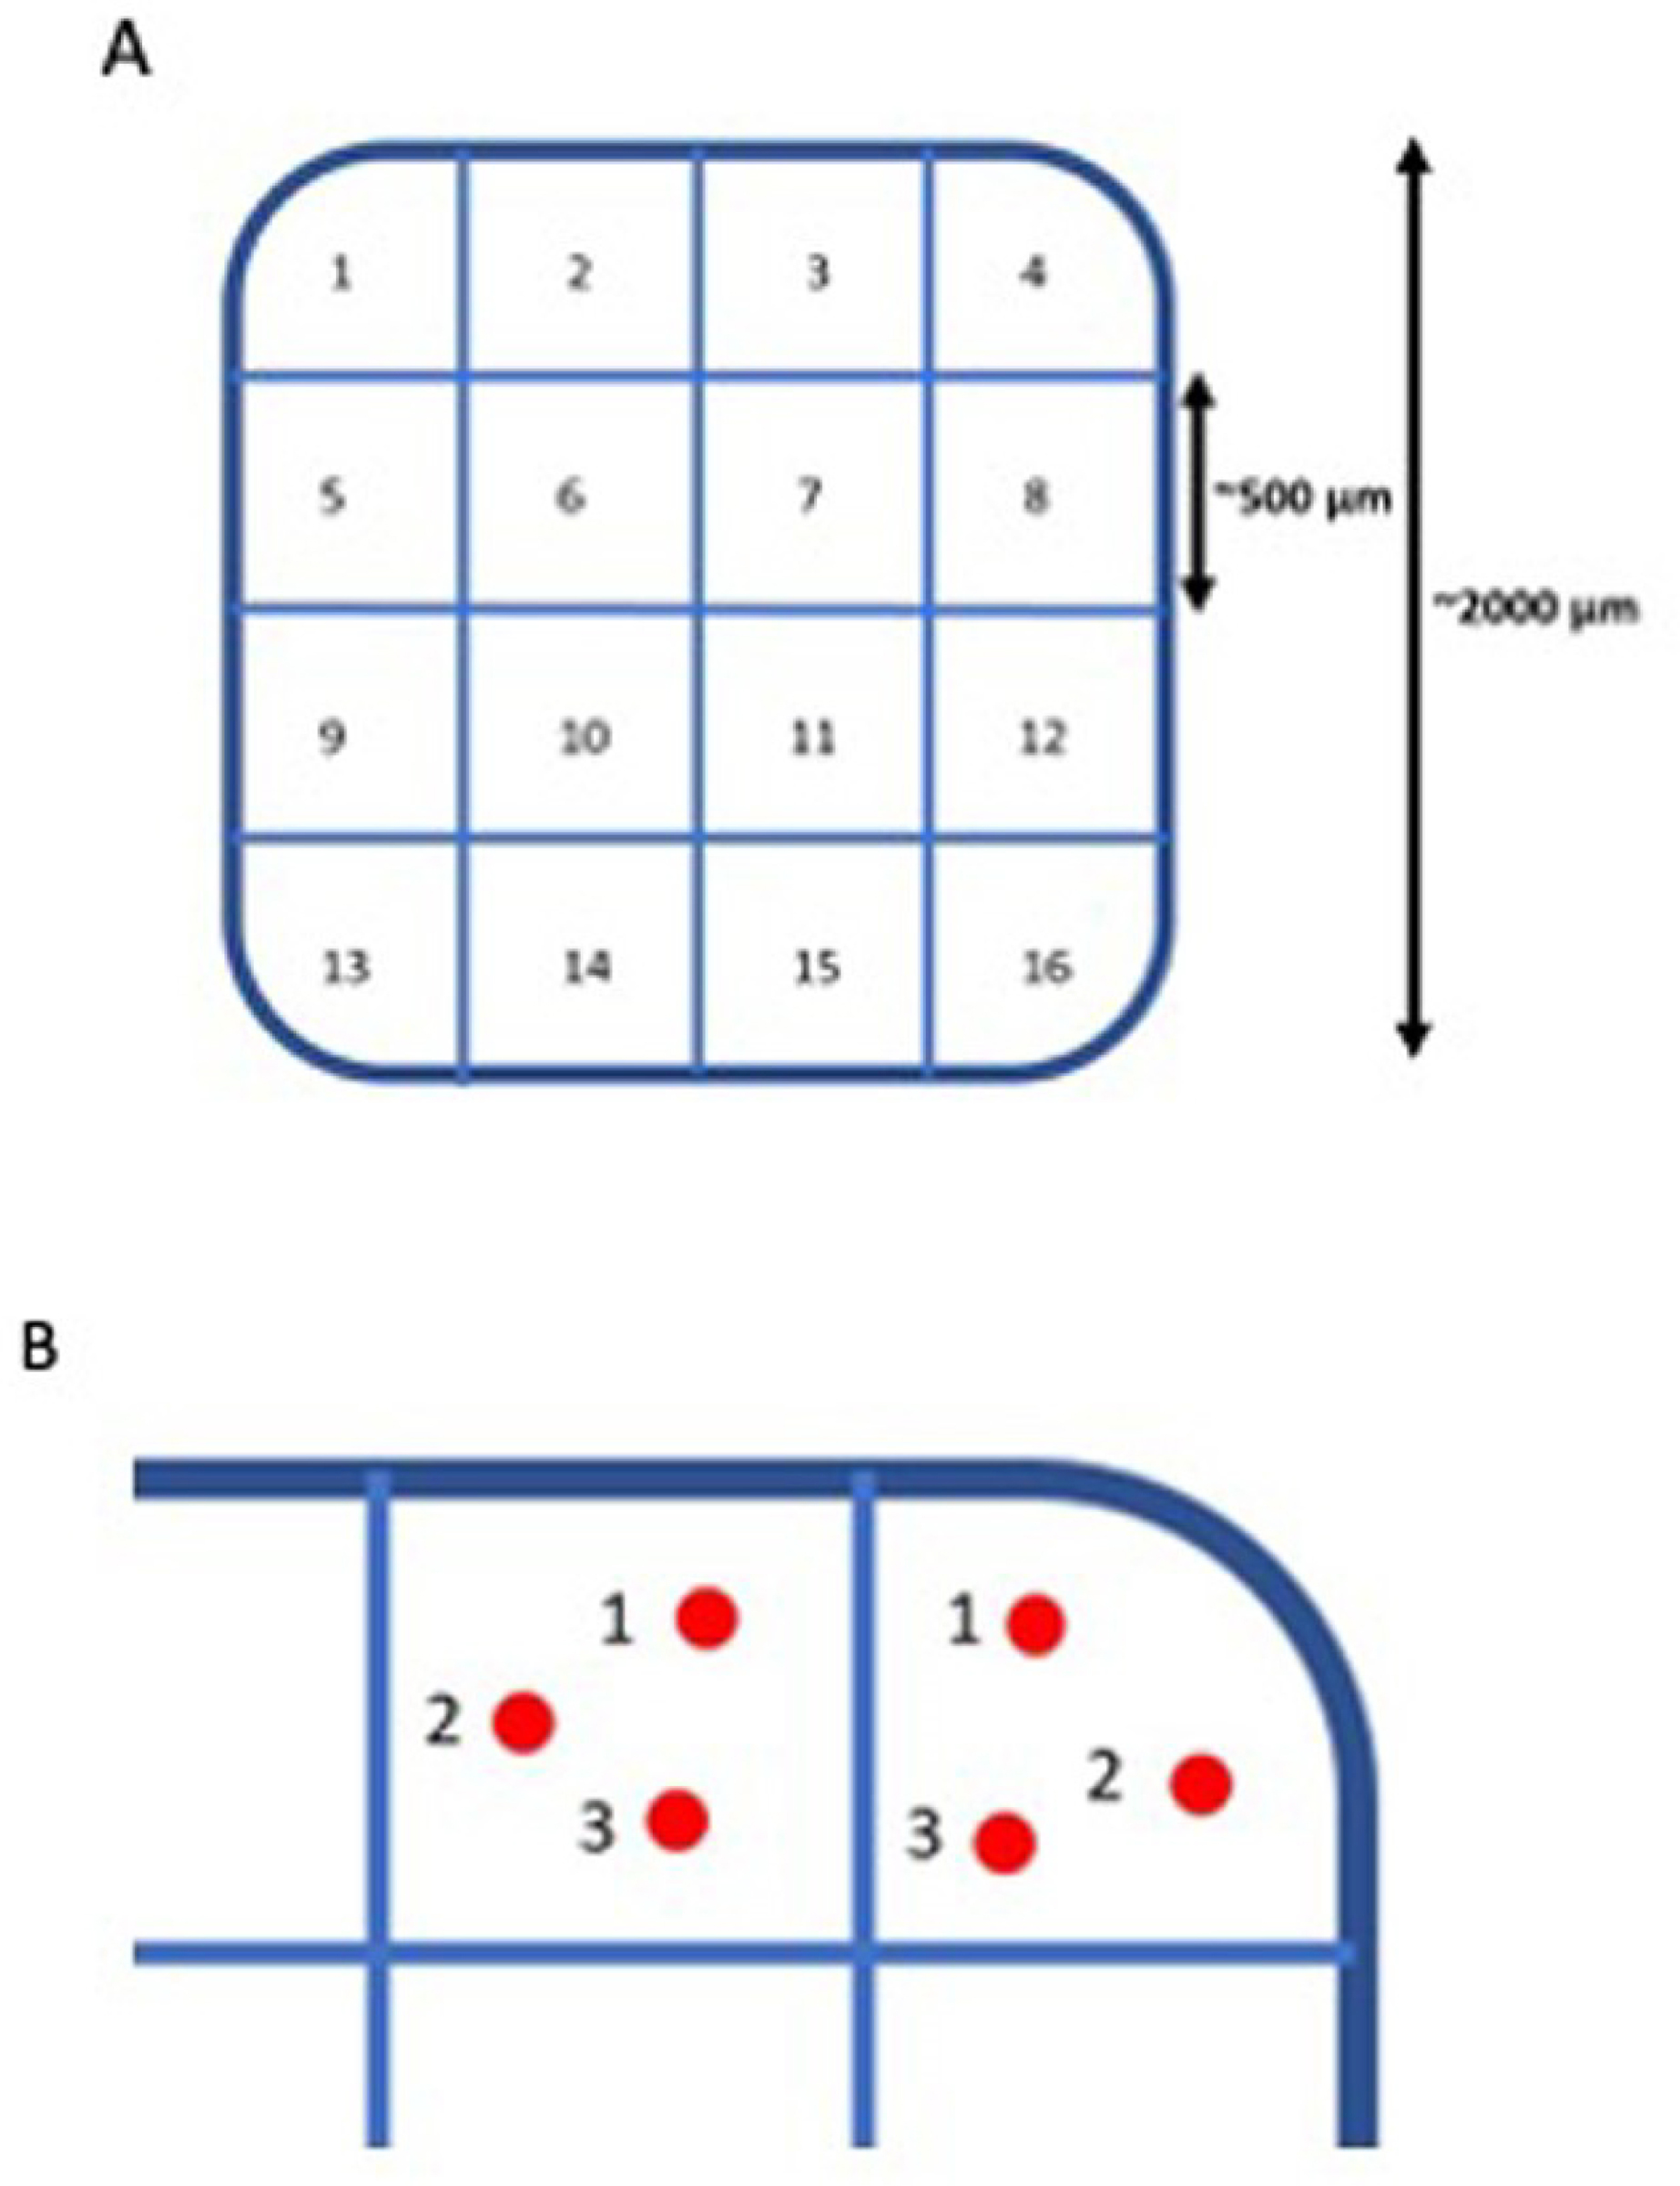
(A) PRIMA retinal implant analysis with 16 sectors of analysis. (B) Visual representation of the three measure points in each sampling region
Official websites use .gov
A
.gov website belongs to an official
government organization in the United States.
Secure .gov websites use HTTPS
A lock (
) or https:// means you've safely
connected to the .gov website. Share sensitive
information only on official, secure websites.
(A) PRIMA retinal implant analysis with 16 sectors of analysis. (B) Visual representation of the three measure points in each sampling region