
Figure 7:
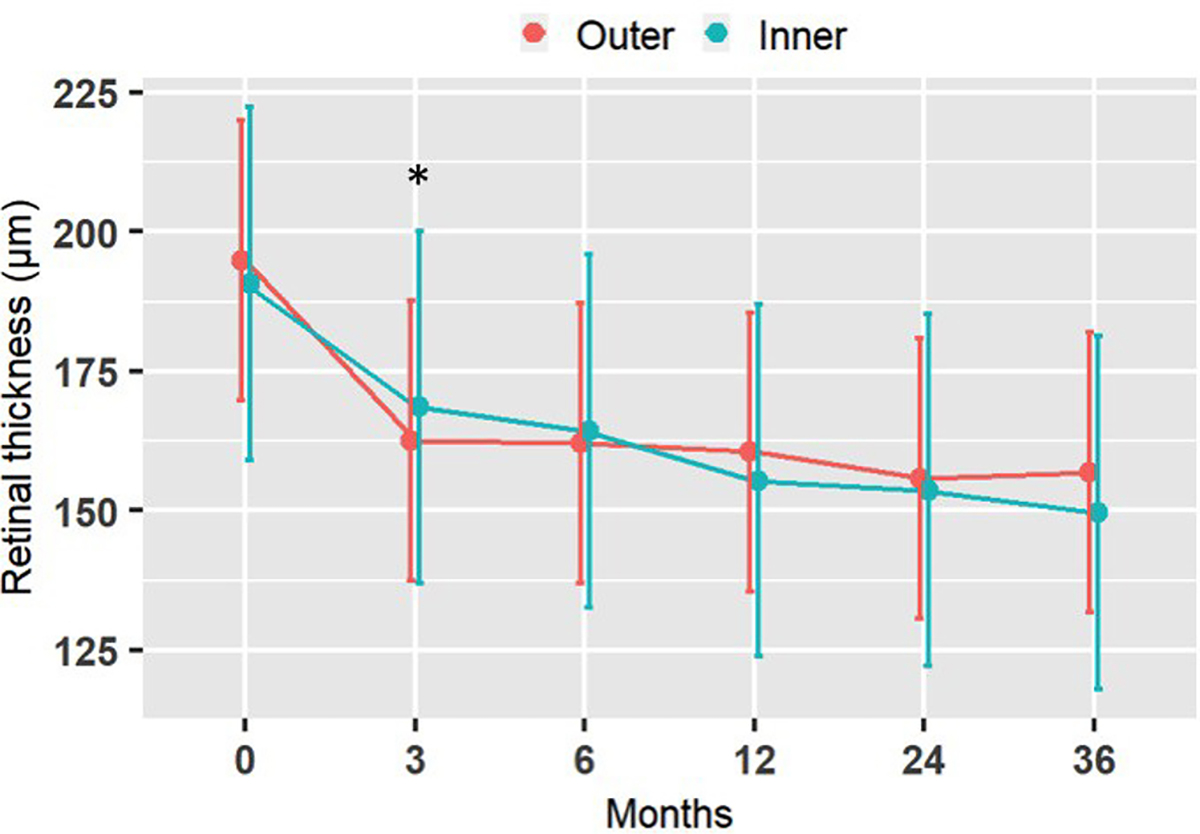
Retinal thickness at the outer and inner locations of the implant over time, averaged among all subjected. Vertical lines are 95% confidence intervals for the marginal means. * significant change from baseline to 3 months
Official websites use .gov
A
.gov website belongs to an official
government organization in the United States.
Secure .gov websites use HTTPS
A lock (
) or https:// means you've safely
connected to the .gov website. Share sensitive
information only on official, secure websites.
Retinal thickness at the outer and inner locations of the implant over time, averaged among all subjected. Vertical lines are 95% confidence intervals for the marginal means. * significant change from baseline to 3 months