
Figure 8:
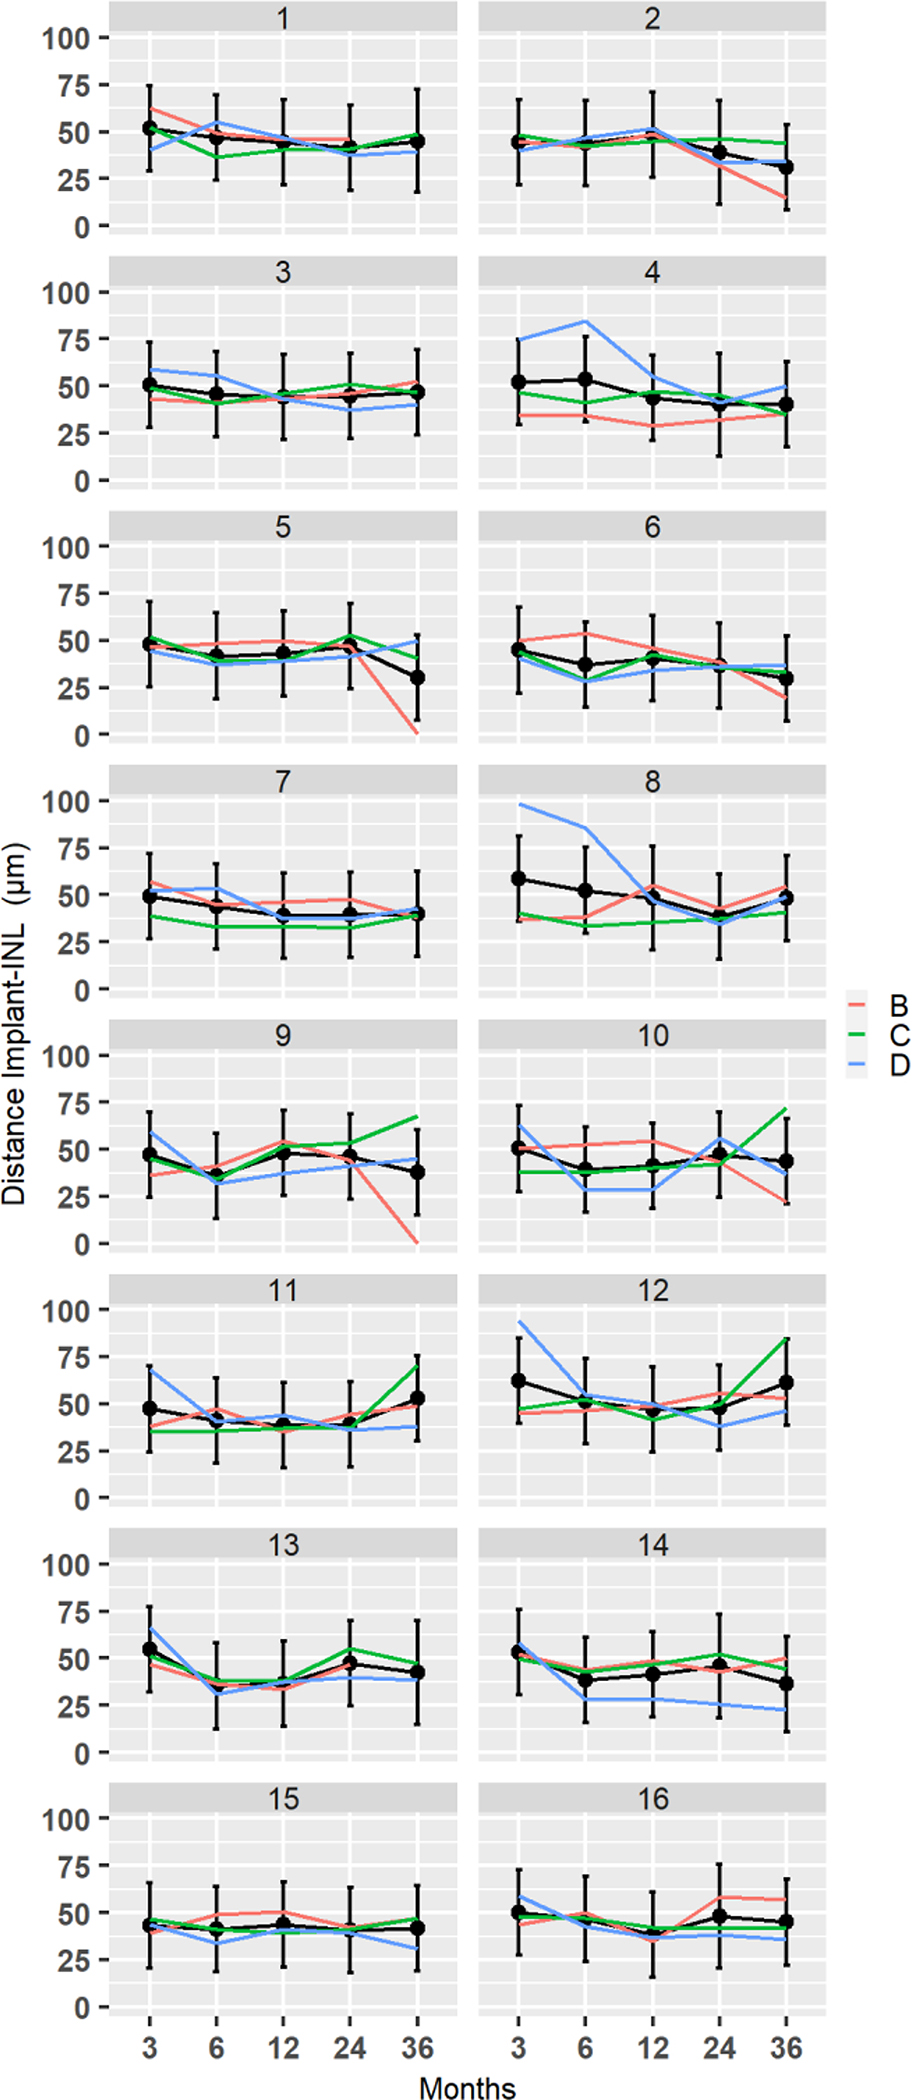
Distance from the implant to INL at 16 implant locations for subjects B, C, and D. Black lines are fitted trajectories for each region obtained from the least square regression model. The vertical lines are 95% confidence intervals for the marginal means