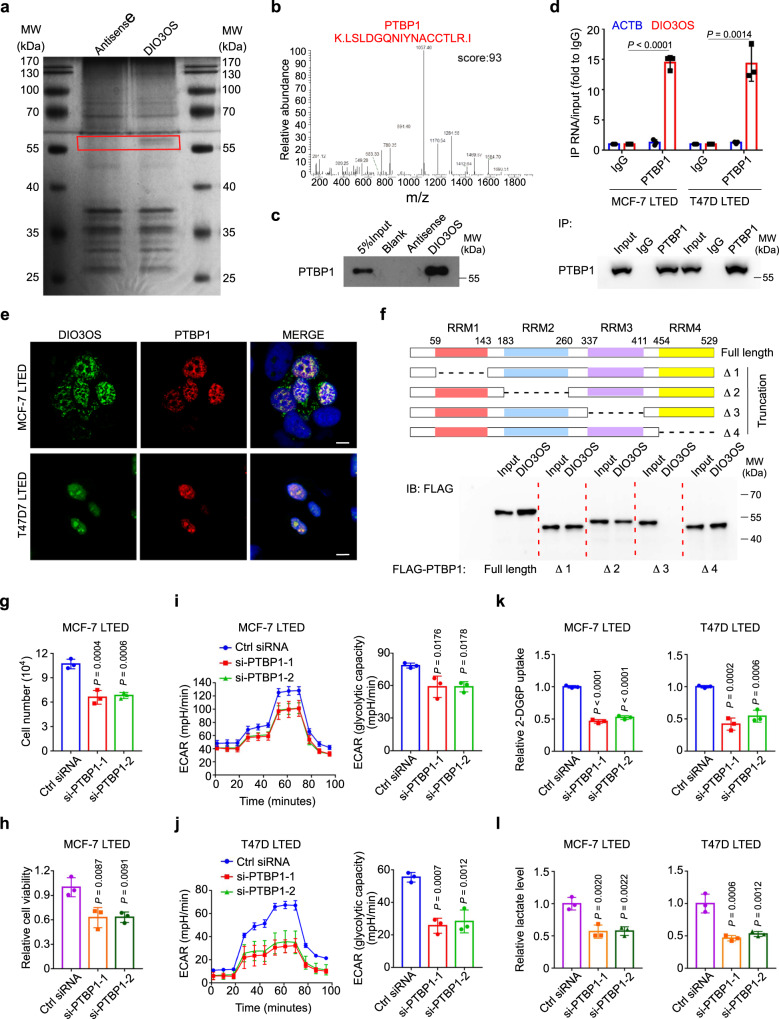
Fig. 3. DIO3OS interacts with PTBP1 in the nucleus.
a Biotin-RNA pulldown assay using full-length DIO3OS transcript (sense) and the antisense RNA, followed by silver staining. Red box indicates the differential band. MW molecular weight. b Mass spectrometry profile of DIO3OS-binding protein PTBP1 with high score. c Biotin-RNA pulldown assay followed by western blot demonstrating the interaction of DIO3OS and PTBP1. MW, molecular weight. d RNA immunoprecipitation assay with the anti-PTBP1 antibody demonstrating the interaction of DIO3OS and PTBP1 in MCF-7/T47D LTED cells. MW, molecular weight. e Fluorescence assessment of the subcellular colocalization of DIO3OS and PTBP1 in MCF-7/T47D LTED cells. DIO3OS and PTBP1 were detected respectively by RNA FISH (green) and immunofluorescence (red) staining. Scale bars, 10 μm. f Biotin-RNA pulldown assay followed by western blot demonstrating the interaction of DIO3OS and the RNA recognition motifs (RRMs) of PTBP1. Schematic diagram for PTBP1 truncation variants deleting the RRM1, RRM2, RRM3, or RRM4 (upper). Representative western blot for in vitro binding of FLAG-tagged PTBP1 truncation variants with DIO3OS (bottom). MW, molecular weight. g, h Cell number counting (g) and MTT assay (h) of MCF-7 LTED cells transiently transfected with control or PTBP1 siRNAs. i, j ECAR values and calculated glycolytic capacity of MCF-7 LTED cells (i) and T47D LTED cells (j) transiently transfected with control or PTBP1 siRNAs. k Glucose uptake of MCF-7/T47D LTED cells transiently transfected with control or PTBP1 siRNAs. l Lactate production of MCF-7/T47D LTED cells transiently transfected with control or PTBP1 siRNAs. Means ± s.d. of experimental triplicates (d, g–l), one representative experiment out of three that were similar (a–c, e, f) are shown, and P-values were determined using two-tailed Student’s t-test (d), two-sided one-way ANOVA with Dunnett’s multiple-comparisons test (g–l). Source data are provided as a Source Data file.

