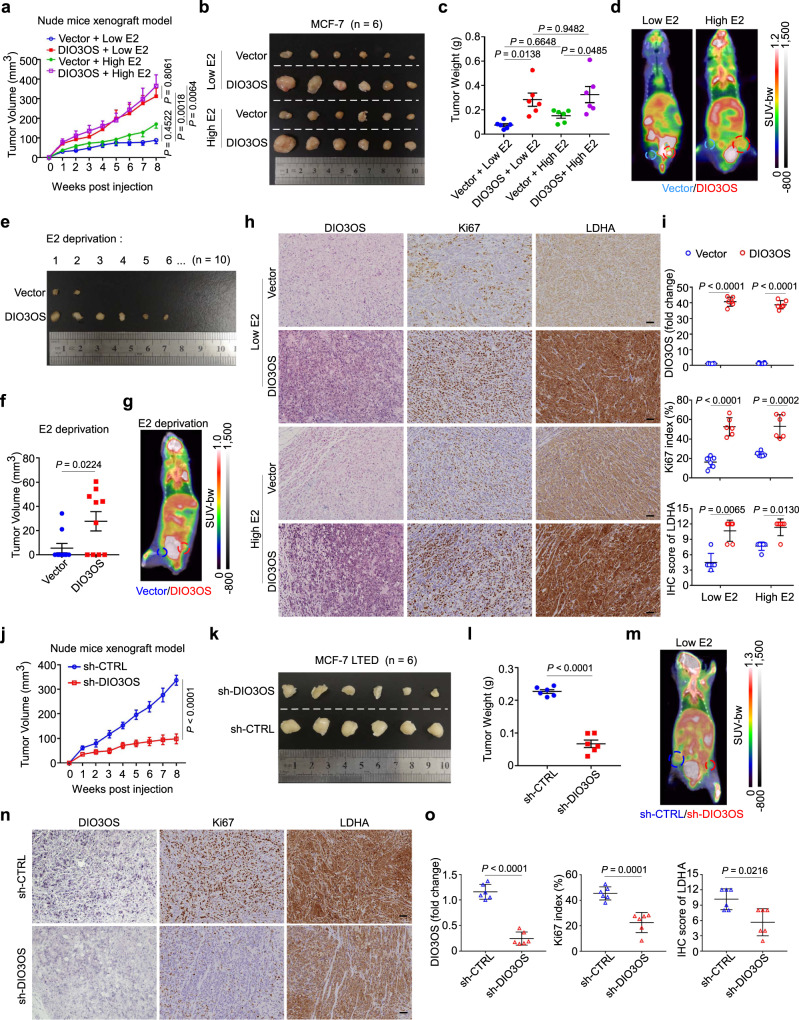
Fig. 7. DIO3OS promotes ER-positive breast tumor progression in vivo.
a–c Growth curves of tumor xenografts (a), tumor size (b), and tumor weight (c) in nude mice bearing parental MCF-7 cells stably transfected with control or DIO3OS-overexpressing plasmid. The mice were pretreated with low or high dose of estrogen tablets. d Representative PET–CT scan images of the glucose accumulation in tumor xenografts arisen from parental MCF-7 cells stably transfected with control or DIO3OS-overexpressing plasmid under low- or high-dose estrogen treatment. e, f Tumor size (e) and tumor volume (f) in mice orthotopically injected with parental MCF-7 cells harboring control or DIO3OS-overexpressing plasmid without estrogen tablet. g Representative PET–CT scan images of the glucose accumulation in tumor xenografts arisen from parental MCF-7 cells stably transfected with control or DIO3OS-overexpressing plasmid without estrogen treatment. h, i Representative ISH staining of DIO3OS and IHC staining for LDHA/Ki67 expression in indicated tumor xenografts arisen from parental MCF-7 cells (h) and the quantitative analyses (i). Scale bars, 50 μm. j–l Growth curves of tumor xenografts (j), tumor size (k), and tumor weight (l) in mice that were orthotopically injected with MCF-7 LTED cells transducing lenti-shDIO3OS or lenti-control. The mice were pretreated with low dose of estrogen tablets. m Representative PET–CT scan images of the glucose accumulation in tumor xenografts arisen from MCF-7 LTED cells transducing lenti-shDIO3OS or lenti-control. n, o Representative ISH staining of DIO3OS and IHC staining for LDHA/Ki67 expression in indicated tumor xenografts arisen from MCF-7 LTED cells (n) and the quantitative analyses (o). Scale bars, 50 μm. For a–c, h–o, n = 6 mice per group. For e, f, n = 10 mice per group. Each dot represents one mouse (c, f, i, l, o). Means ± s.e.m. (a, c, f, j, l) are presented, and P-values were analyzed using two-sided one-way ANOVA with Sidak’s multiple-comparisons test (a, c), two-tailed Student’s t-test (f, j, l). For i, o, means ± s.d. are shown, and P-values were determined using two-tailed Student’s t-test (for DIO3OS expression and Ki67 index), Mann–Whitney test (for IHC score of LDHA). For d, g, m, colored circles denoted the xenografts with indicated treatments. E2 estrogen. Source data are provided as a Source Data file.

