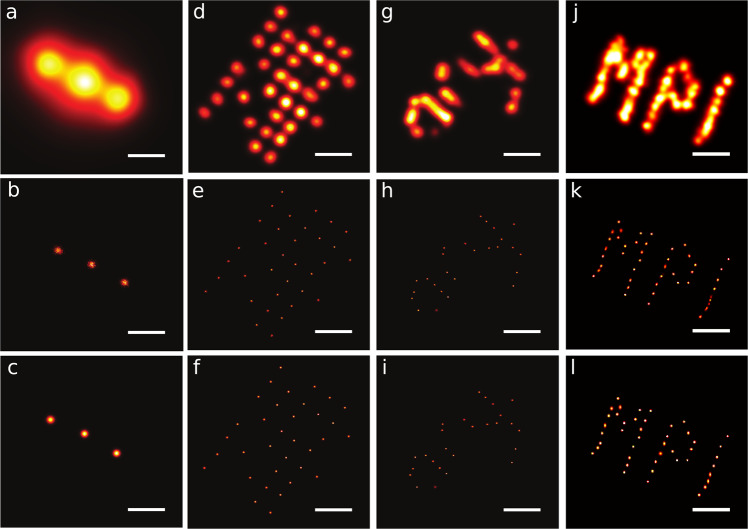
Fig. 2. Bayesian grouping of localizations applied to various structures imaged with DNA-PAINT.
Row 1: Traditional SR analysis with each localization represented by a Gaussian blob of the size of its localization precision. Row 2: Posterior probability image of the chain from BaGoL including all the proposed models. Row 3: The image from the model with the most likely number of emitters (MAPN). a–c Gattaquant DNA rulers with 20 nm spacing between docking strands. The shown images were selected from the BaGoL results of 50 similar structures; d–f DNA-origami grid with 10 nm spacing between docking strands. The shown images were selected from the BaGoL results of 170 similar structures; g–i TUD DNA origami with 5 nm spacing between docking strands. The shown images were selected from the BaGoL results of 170 similar structures (see Supplementary Movie 2); j–l MPI DNA origami with 5 nm spacing between docking strands. The shown images were selected from the BaGoL results of four similar structures. The source data is provided within the paper. The scale bars are 20 nm.

