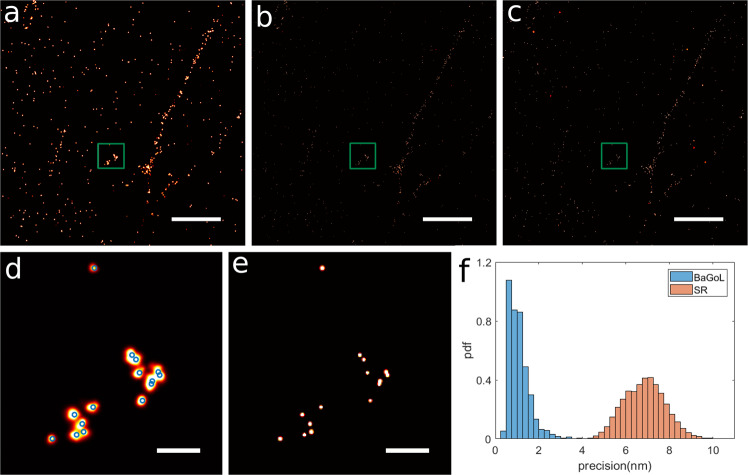
Fig. 3. BaGoL applied to the focal adhesion protein kindlin.
The protein kindlin-GFP was visualized using a DNA-labeled GFP nanobody and imaged via DNA-PAINT. a 5 × 5 μm2 region of traditional super-resolution image. b BaGoL posterior image of panel a. c BaGoL MAPN image of panel a. d Zoom-in of the green box in panel a. Blue circles represent the found emitter coordinates by BaGoL. e Zoom-in of the green box in panel c. f Histograms of the localization precisions from SR data shown in brown (input to BaGoL), and the improved precisions from BaGoL shown in blue. BaGoL was applied to the focal adhesion protein kindlin data for three similar regions. Scale bars in the top and bottom rows are 1000 and 100 nm, respectively.

