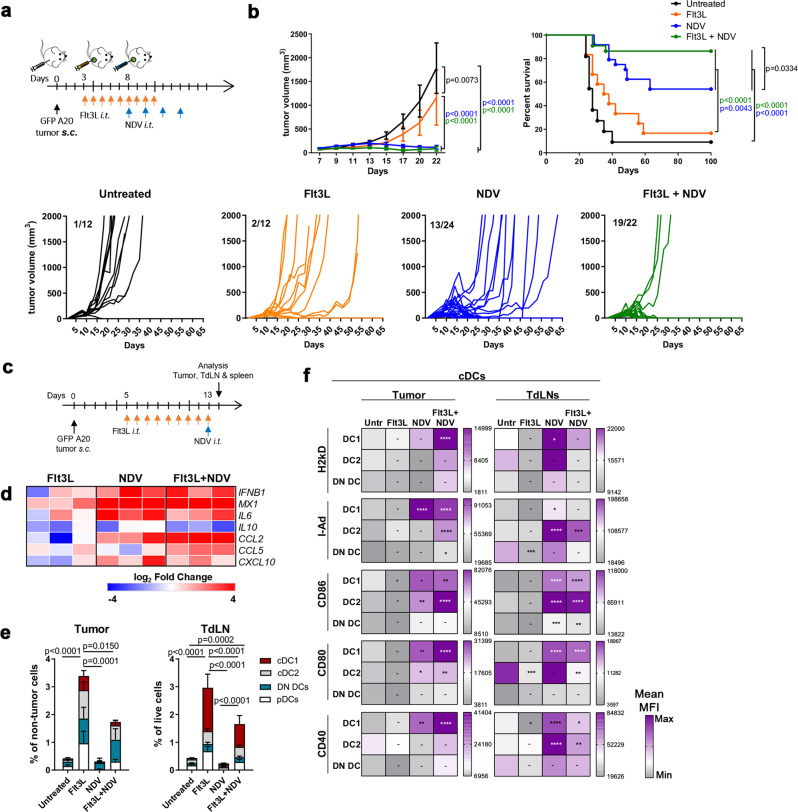
Fig. 3. NDV therapy in DC-enriched tumors potentiates myeloid activation and tumor regressions.
a GFP+ A20 tumor-bearing mice were treated as indicated and (b) followed for tumor growth (mean ± s.e.m, or individual growth curves, lower panel, numbers refer to mice with complete remission (CR) versus total number of mice (CR/total) in each group) and survival; data from untreated (untr, n = 11), Flt3L (n = 12), NDV (n = 24) and Flt3L+NDV (n = 22) groups, pooled from 2 independent experiments. Two-way ANOVA with Tukey’s multiple comparisons test (tumor size) and Log-rank (Mantel-Cox) test (survival). c GFP+ A20 tumor-bearing mice were treated as indicated and tumor, TdLNs and spleens were harvested and analyzed by quantitative RT-PCR (heat map, log2 fold changes vs ‘Untreated’) (d) or by spectral flow cytometry (e, f) (n = 5). e Stacked bar graphs of cDC1 (XCR1+), cDC2 (CD11b+), DN (XCR1-CD11b double-negative) cDC (CD11c+I-Ad+) subsets and pDCs (B220+Ly6Chi CD11clowI-Adlow) in the tumor or TdLNs. Statistics show differences in the total DC population between treatments. One-way ANOVA with Tukey’s multiple comparisons test. f The heat maps show the relative expression (mean MFI of 5 individual mice) of activation markers in different cDC subsets. Two-way ANOVA with Holm-Sidak’s multiple comparisons test (vs untreated). Data show mean ± SD. *p < 0.05, **p < 0.01, ***p < 0.001, ****p < 0.0001.

