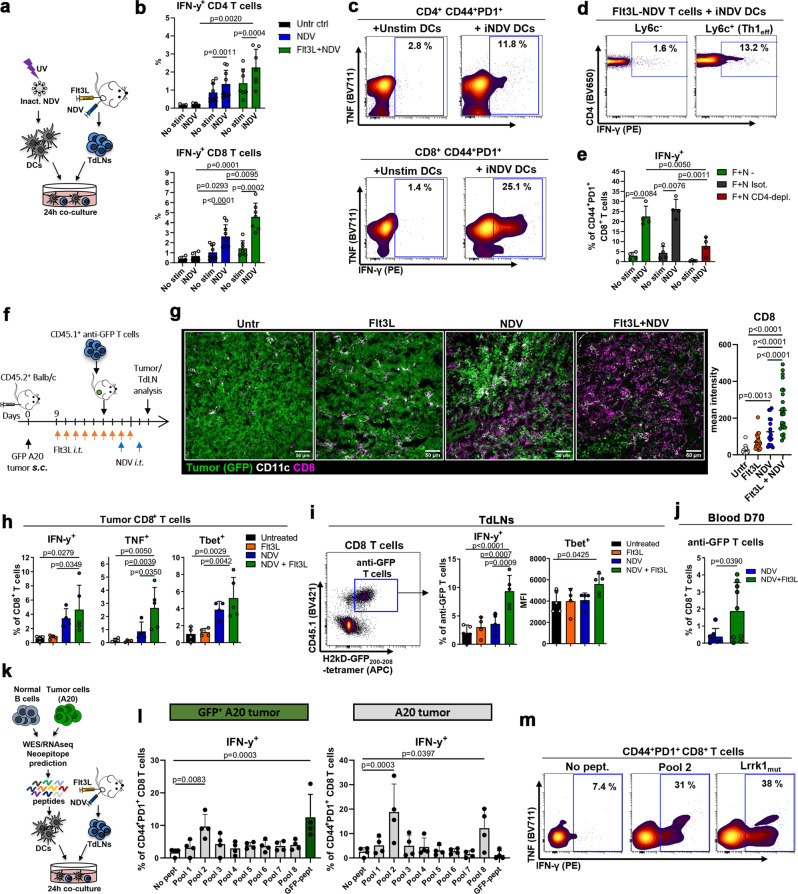
Fig. 6. Combination therapy enhances viral and tumor Ag responses in vivo.
a–d TdLNs from untreated (ctrl), NDV- or Flt3L+NDV-treated A20-tumor-bearing mice were co-cultured with DCs: unstimulated (No stim) or pulsed with UV-inactivated NDV (iNDV); T cells were analyzed after 24 h. b IFN-γ+ T cells in untreated (n = 4), NDV (n = 9) and Flt3L+NDV (n = 7) groups, pooled from 2 independent experiments. Paired, two-tailed t-test (No stim vs iNDV) or one-way ANOVA with Tukey’s multiple comparisons test for comparison between treatments. c, d Percentage of iNDV-reactive cells within CD44+PD1+ CD4+ (top) or CD8+ (bottom) T cells (c) and within Ly6C− vs Ly6C+ CD4+ T cells (d). e TdLN T cells from Flt3L+NDV-treated A20-tumor-bearing mice pre-treated with CD4-depleting or isotype-control antibodies were analyzed as in (a). Paired, two-tailed t-test (No stim vs iNDV) or one-way ANOVA with Tukey’s multiple comparisons test for comparison between treatments (n = 4). f GFP+ A20-tumor-bearing mice were treated as indicated, anti-GFP CD45.1+CD8+ T cells were adoptively transferred, and tumoral/TdLN T cells were analyzed after 5 days by immunofluorescence (g) or spectral flow cytometry (h, i). g Representative tumor images, and CD8 mean intensity from a total of 18-27 20x images per group (Untr and NDV, n = 2; Flt3L and Flt3L+NDV, n = 3); One-way ANOVA with Tukey’s multiple comparisons test. h IFN-γ, TNF and Tbet expression in intratumoral CD8+ T cells. i Representative dot plot showing anti-GFP JEDI T cells in the TdLN (left) and bar graphs of JEDI IFN-γ and Tbet expression (right). h, i n = 5 mice per group; one-way ANOVA with Dunnett’s multiple comparisons test. j Mice with complete remissions (NDV, n = 7; Flt3L+NDV, n = 9) were analyzed for blood tetramer+ anti-GFP CD8+ T cells day 70 after tumor inoculation. Unpaired, two-tailed t-test. k–m TdLN cells from Flt3L+NDV-treated A20 or GFP+ A20-tumor-bearing mice were co-cultured with DCs pulsed with pooled or individual neoepitope peptides identified by exome and RNA sequencing, or GFP-peptide. l, m IFN-γ production after 24 h; data pooled from 2 independent experiments, n = 4 mice per tumor type, one-way ANOVA with Dunnett’s multiple comparisons test (l) and representative (n = 4) contour plots of CD44+PD1+CD8+ T cells reactive to peptide pool 2 and Lrrk1mut (m). Data show mean ± SD.

