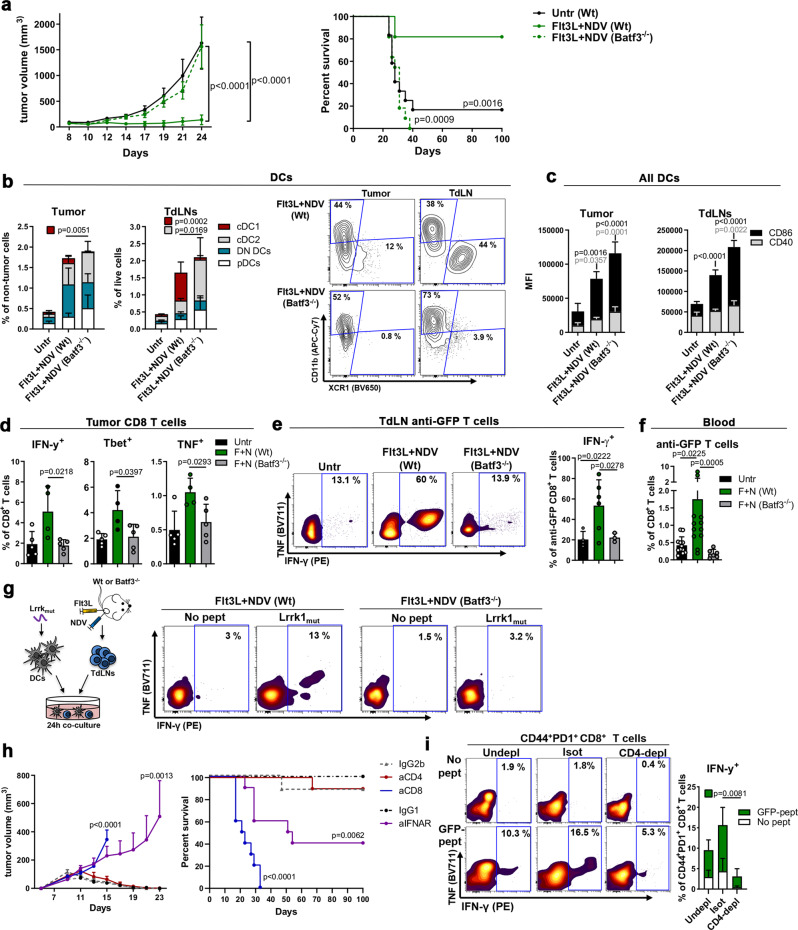
Fig. 7. Batf3-DCs are critical for the anti-tumor effects of Flt3L + NDV.
a Flt3L+NDV-treated GFP+ A20-tumor-bearing Wt or Batf3−/− mice were followed for tumor growth (mean ± s.e.m) and survival (untreated, n = 12; Flt3L+NDV Wt, n = 11; Flt3L+NDV Batf3−/−, n = 11). Two-way ANOVA with Tukey’s multiple comparisons test (tumor size) and Log-rank (Mantel-Cox) test (survival). b, c Tumors/TdLNs from treated GFP+ A20-tumor-bearing mice were analyzed by spectral flow cytometry. Stacked bar graphs and representative contour plots of cDC1, cDC2, DN cDCs or pDCs (b) and stacked bar graphs of CD86/CD40 expression (vs Untr) in all cDCs (c). b, c One-way ANOVA with Tukey’s multiple comparisons test; n = 5 mice per group. d, e GFP+ A20-tumor-bearing Wt or Batf3−/− mice were treated with Flt3L+NDV. Anti-GFP CD45.1+CD8+ (JEDI) T cells were adoptively transferred and tumoral/TdLN T cells were analyzed after 5 days. IFN-γ, TNF and Tbet expression in intratumoral CD8+ T cells (Untr; n = 5, Flt3L+NDV Wt, n = 4, Flt3L+NDV Batf3−/−, n = 5) (d) and representative contour plots and bar graphs showing IFN-γ in JEDI T cells from TdLNs (after completed treatment) upon GFP-peptide stimulation ex vivo (e) (Untr; n = 4, Flt3L+NDV Wt, n = 6, Flt3L+NDV Batf3−/−, n = 3). f Mice in (a) were analyzed for blood anti-GFP tetramer+CD8+ T cells 7 days after completed treatment. Kruskal-Wallis with Dunn’s multiple comparisons test; n = 12 (untr, Flt3L+NDV Wt) and n = 6 (Flt3L + NDV Batf3−/−). g TdLN cells from tumor-bearing Flt3L+NDV-treated mice were co-cultured with Lrrk1mut peptide-pulsed DCs; T cells were analyzed after 24 h. IFN-γ in CD44+PD1+CD8+ T cells, representative from two A20- and three GFP+ A20-bearing mice. h GFP+ A20-tumor-bearing Wt mice treated with anti-CD8, anti-CD4, anti-IFNAR or isotype-control antibodies were treated with Flt3L+NDV and followed for tumor growth (mean ± s.e.m) and survival. Two-way ANOVA with Sidak’s multiple comparisons test (tumor size) and Log-rank (Mantel-Cox) test (survival); n = 8 (IgG2b), n = 9 (IgG1, anti-CD8), n = 10 (anti-CD4, anti-IFNAR). i TdLNs from mice treated as in (g) with anti-CD4 or isotype-control antibodies and Flt3L+NDV were co-cultured with unstimulated (No pept) or GFP-peptide pulsed (GFP-pept) DCs and analyzed after 24 h. Representative contour plots and quantification of IFN-γ in CD44+PD1+CD8+ T cells. One-way ANOVA with Tukey’s multiple comparisons test, n = 4 mice per group. Data show mean ± SD.

