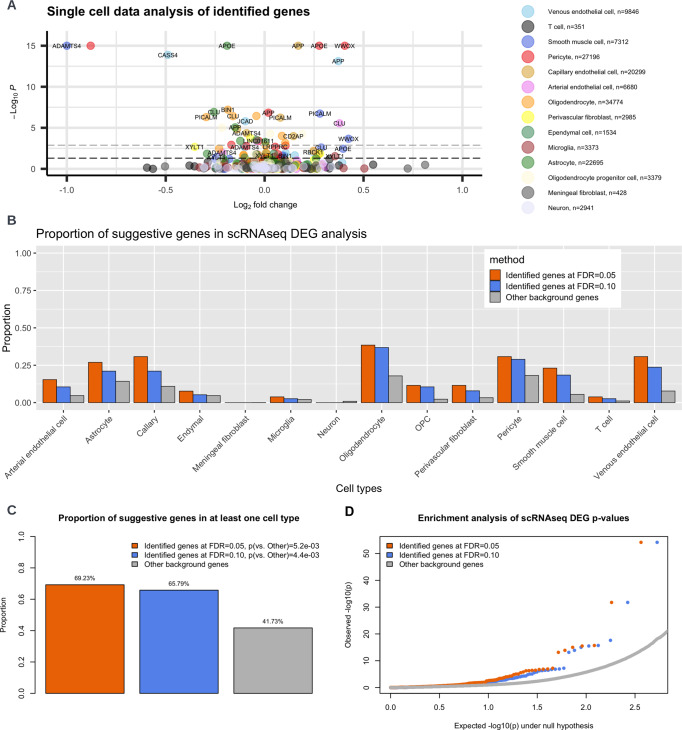
Fig. 4. Single-cell RNAseq data (n = 143793) analysis of the identified proximal AD genes.
A Differentially expressed genes (DEG) analysis using MAST implemented in Seurat, comparing Alzheimer’s disease cases (AD) with healthy controls. Each dot represents a gene. Colors represent different cell types. OPC: Oligodendrocyte progenitor cell. The black dashed line corresponds to p-value cutoff 0.05; the gray dashed line corresponds to p-value cutoff 0.05/38 (number of candidate genes) which accounts for multiple comparisons. For visualization purposes, −log10(p) values are capped at 15 and abs(log2(fold change)) values are capped at 1.0. Positive log2 fold change corresponds to higher expression level in AD. B Proportion of suggestive genes stratified by cell types. C Proportion of suggestive genes in at least one cell type. P-values are calculated with two-sided Fisher’s exact test. D Enrichment analysis of DEG nominal p-values relative to background genes. P-values are calculated by MAST implemented in Seurat.

