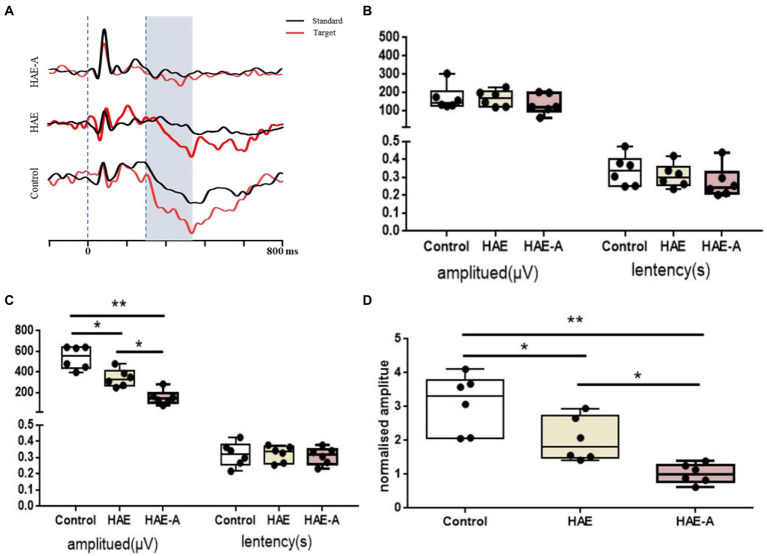
Figure 3.
Variation of P300 of the oddball behavioral paradigm training test. (A) The profile of P300 in control, HAE and HAE-A group, respectively; (B) The result of P300 evoked by standard tone stimulation; (C) The result of P300 evoked by target tone stimulation; (D) The result of normalized P300 amplitude by target/standard. Data are presented with the means ± standard deviation (n = 6). *Difference is significant at the 0.05 level (p < 0.05); **difference is significant at the 0.01 level (p < 0.01).

