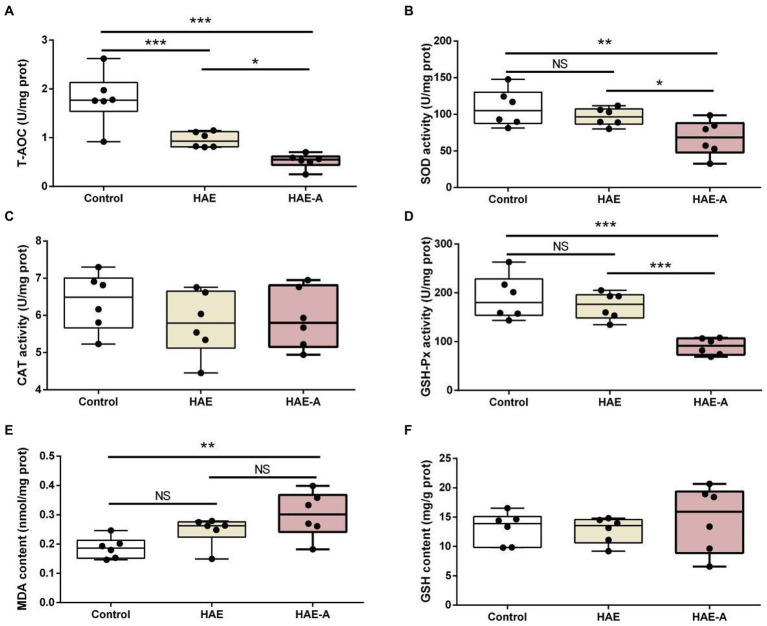
Figure 4.
Antioxidant capacity in the prefrontal cortex. Data are presented with the means ± standard deviation (n = 6). NS, not significant (p > 0.05); *difference is significant at the 0.05 level (p < 0.05); **difference is significant at the 0.01 level (p < 0.01); ***difference is significant at the 0.001 level (p < 0.001). (A–F) Activities or contents of T-AOC, SOD, CAT, GSH-Px, MDA, and GSH, respectively. T-AOC, total antioxidation capacity; SOD, superoxide dismutase; CAT, catalase; GSH-Px, glutathione peroxidase; MDA, malondialdehyde; GSH, glutathione.

