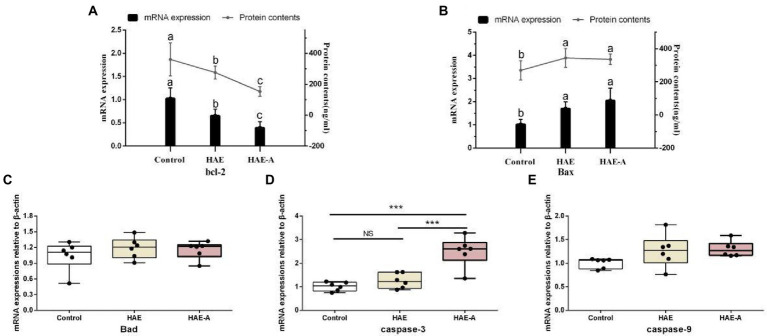
Figure 5.
Apoptosis-related functional protein contents and mRNA expression levels in the prefrontal cortex. Data are presented with the means ± standard deviation (n = 6). Bars with different letters are significantly different on the basis of Duncan’s multiple-range test (p < 0.05). NS, not significant (p > 0.05); *difference is significant at the 0.05 level (p < 0.05); **difference is significant at the 0.01 level (p < 0.01); ***difference is significant at the 0.001 level (p < 0.001). (A,B): mRNA expression levels and protein contents of bcl-2 and Bax; (C–E): mRNA expression levels of Bad, caspase-9 and caspase-3, respectively.

