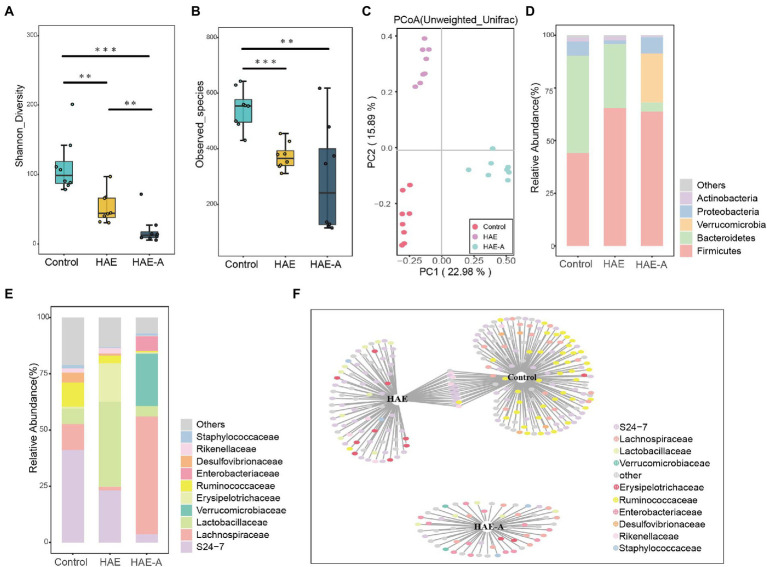
Figure 6.
Effects of hypoxia on the structure of colon microbiota in normal mice and antibiotic drinking mice. (A) Intestinal microbial community diversity in each group (Shannon). Meaning: Wilcoxon. (B) Gut microbiome richness (observed species) in colonic luminal samples of each group. Significance: Wilcoxon. (C) Principal Coordinate Analysis (PCoA) of Unweighted UniFrac Distance between groups. (D) Relative abundance at phylum level in each group (%). (E) Relative abundance at each family level (%). (F) Bipartite networks of indicator species analysis. It displays different treatment-specific ASVs in the colonic bacterial communities using indicator species analysis. Circles represent individual bacteria and ASVs that are positively and significantly associated (p < 0.05) with one or more different grouping factors (association(s) given by connecting lines). ASVs are colored according to their Family assignment.

